Primary Data Sources
| Source | Data | Years | Variables | Coverage |
|---|---|---|---|---|
| NCI State Cancer Profiles | Age-adjusted cancer incidence & mortality rates | 2016–2020 | ~90 cancer types/metrics | 3,029 counties (all-site) |
| USGS PNSP | Agricultural pesticide application estimates | 2019 + historical (1997–2017) | Total, herbicide, insecticide, fungicide + 12 compounds | 3,063 counties |
| Census ACS | Demographic & socioeconomic characteristics | 2018–2022 (5-year) | Income, poverty, education, age, race/ethnicity | 3,222 counties |
| CDC PLACES | Health behavior & chronic disease prevalence | 2023 release | Smoking, obesity, drinking, diabetes, physical inactivity | 2,957 counties |
| USDA NASS | Livestock inventories & crop acreage | 2022 Census of Agriculture | Hogs, cattle, chickens, total crop acres | 2,890–3,060 counties |
| EPA AQS | PM2.5 air quality (annual mean) | 2019 | Fine particulate matter (μg/m³) | ~800 monitor counties |
| USGS WQP | Nitrate water contamination | 2015–2023 | Mean nitrate (mg/L) | ~1,500 counties |
| CDC EPHT | Temporal cancer incidence panel | 2001–2020 (16 windows) | 9 cancer types, age-adjusted rates | 2,727 counties |
| County Health Rankings | Historical health behavior trends | 2010–2024 | Smoking, obesity, drinking, inactivity over time | ~3,000 counties |
| CDC WONDER | Cancer mortality trends | 1999–2022 | Age-adjusted mortality rates by cause | ~3,100 counties |
| EPA SDWIS | Drinking water violations | 2010–2023 | MCL violations, monitoring violations | All public water systems |
Coverage Summary
Key Variable Coverage
Coverage varies by data source. Cancer rates for rare types have more suppressed (missing) counties due to NCI small-count suppression rules. The table below shows the 20 most complete variables.
| Variable | Counties Available | Missing | Missing % |
|---|---|---|---|
| Rural-Urban Continuum Code | 3,233 | 15 | 0.5% |
| Median household income | 3,222 | 26 | 0.8% |
| Total population | 3,222 | 26 | 0.8% |
| Median age | 3,222 | 26 | 0.8% |
| Poverty rate | 3,222 | 26 | 0.8% |
| Total pesticide (kg) | 3,063 | 185 | 5.7% |
| Pesticide density (kg/mi²) | 3,055 | 193 | 5.9% |
| Cattle inventory | 3,060 | 188 | 5.8% |
| Cancer rate (all-site) | 3,029 | 219 | 6.7% |
| Smoking prevalence | 2,957 | 291 | 9.0% |
| Obesity prevalence | 2,957 | 291 | 9.0% |
| Cancer rate (colorectal) | 2,706 | 542 | 16.7% |
| Cancer rate (kidney) | 2,280 | 968 | 29.8% |
| Cancer rate (NHL) | 2,169 | 1,079 | 33.2% |
| Cancer rate (leukemia) | 1,967 | 1,281 | 39.4% |
Data Suppression
NCI suppresses cancer rates for counties with fewer than 16 cases over the reporting period to protect patient privacy. This means rarer cancer types (leukemia, NHL, bladder) have substantially more missing counties, which reduces statistical power and limits BYM2 analyses to the largest connected component of the county adjacency graph.
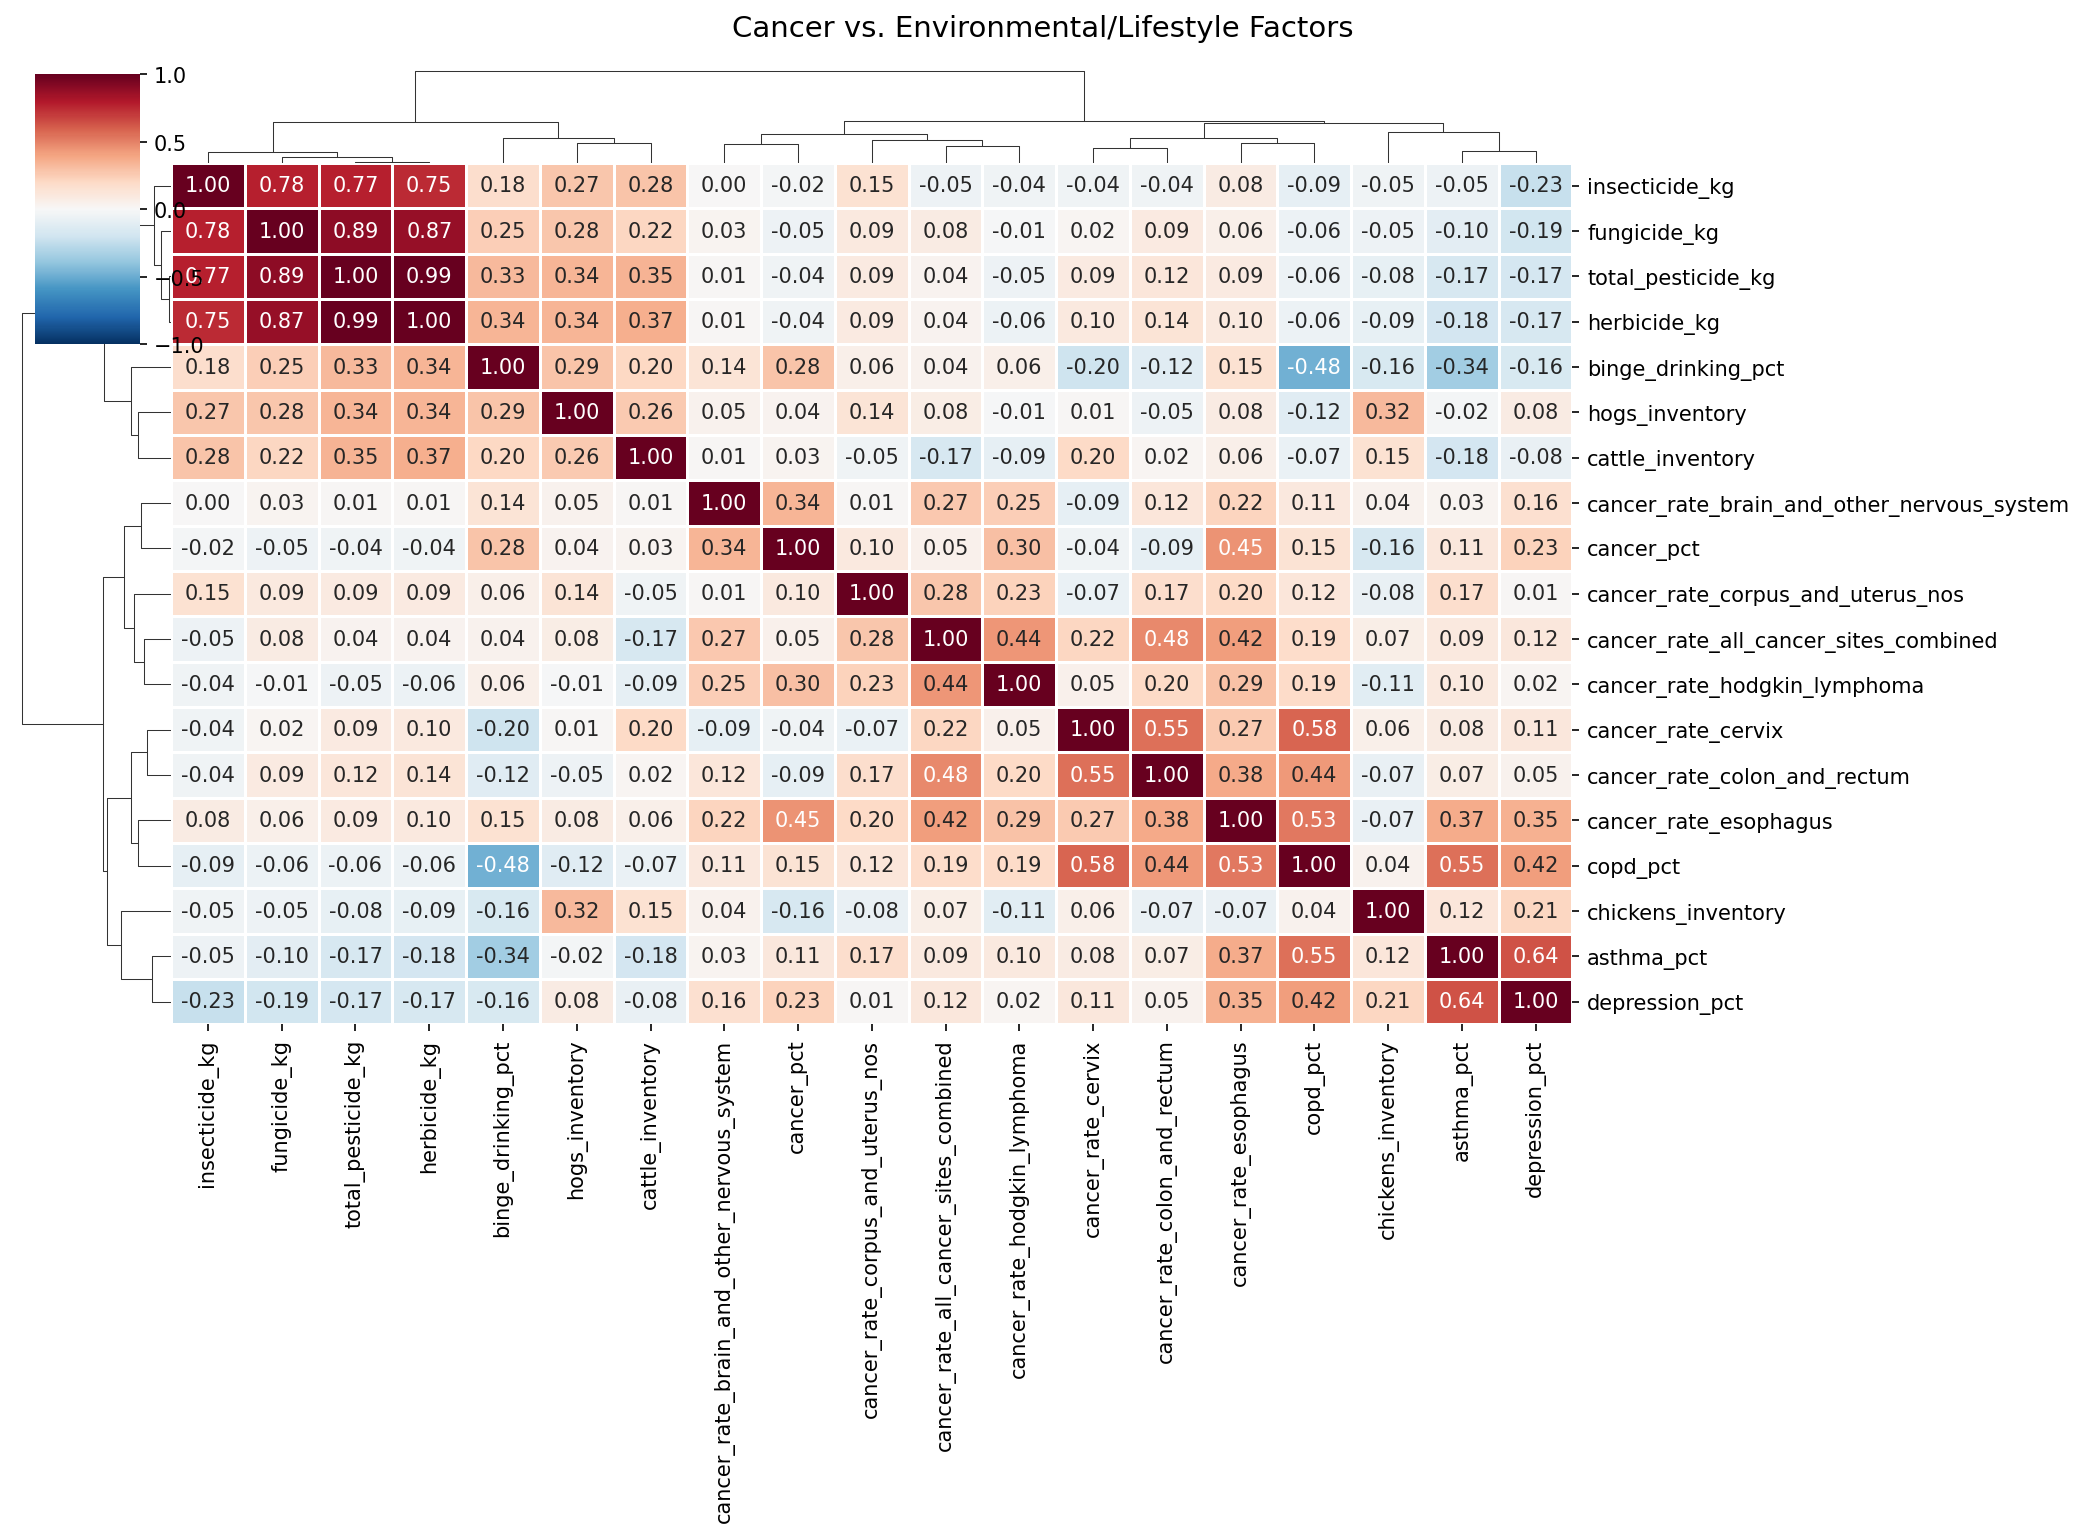
Correlation Structure
Data Processing Pipeline
Raw data from each source is downloaded via API or web scraping (notebooks 01–01e), then cleaned and merged on 5-digit FIPS codes (notebooks 02–02e). Key processing steps:
- FIPS standardization: zero-padding, known remap corrections (Shannon County SD → Oglala Lakota, etc.)
- Pesticide density: total kg divided by county area (sq miles) to normalize for county size
- Livestock density: inventory counts divided by county area
- Compound-specific aggregation: 12 individual active ingredients extracted from USGS low/high estimates
- Historical pesticide panels: 1997, 2002, 2007, 2012, 2017 for long-difference analysis
- Temporal cancer panel: CDC EPHT data across 16 rolling 5-year windows (2001–2020)
- Historical health behaviors: County Health Rankings (2010–2024) for long-difference gauntlets
- All continuous predictors standardized (z-score) before regression