Methodology
Rather than testing only pesticide exposure, this analysis screens every available predictor (demographics, health behaviors, environmental factors, agricultural variables) against all 26 cancer types simultaneously. Four analytical layers are applied:
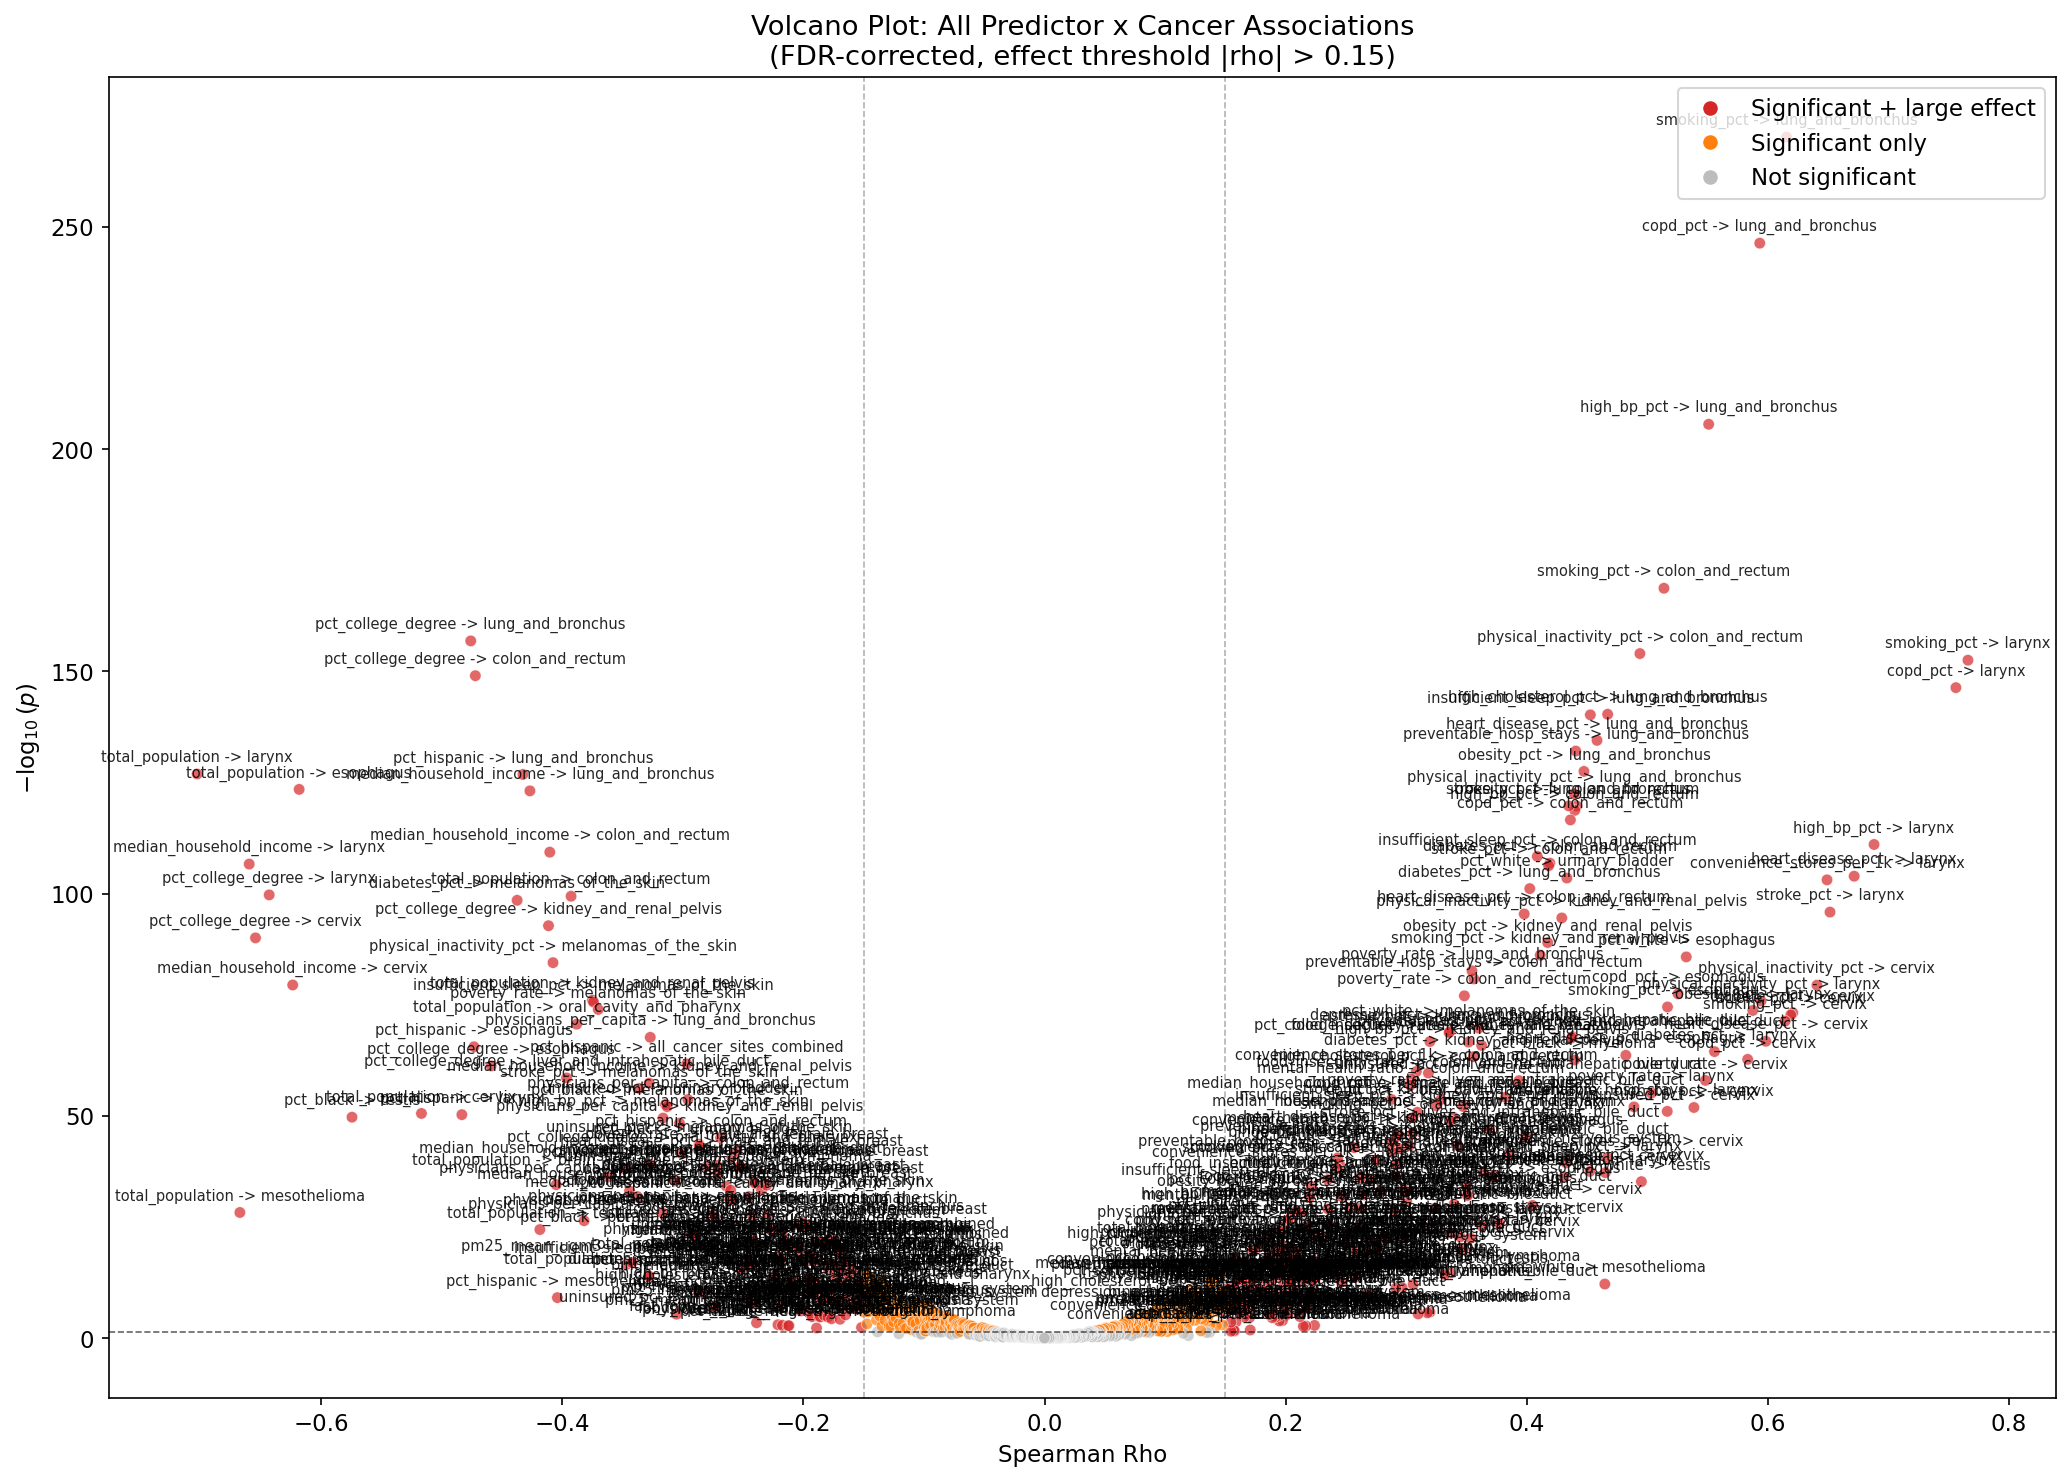
- Spearman correlations with Benjamini-Hochberg FDR correction (q < 0.05)
- Partial correlations controlling for 9 baseline confounders
- LASSO variable selection (cross-validated regularization)
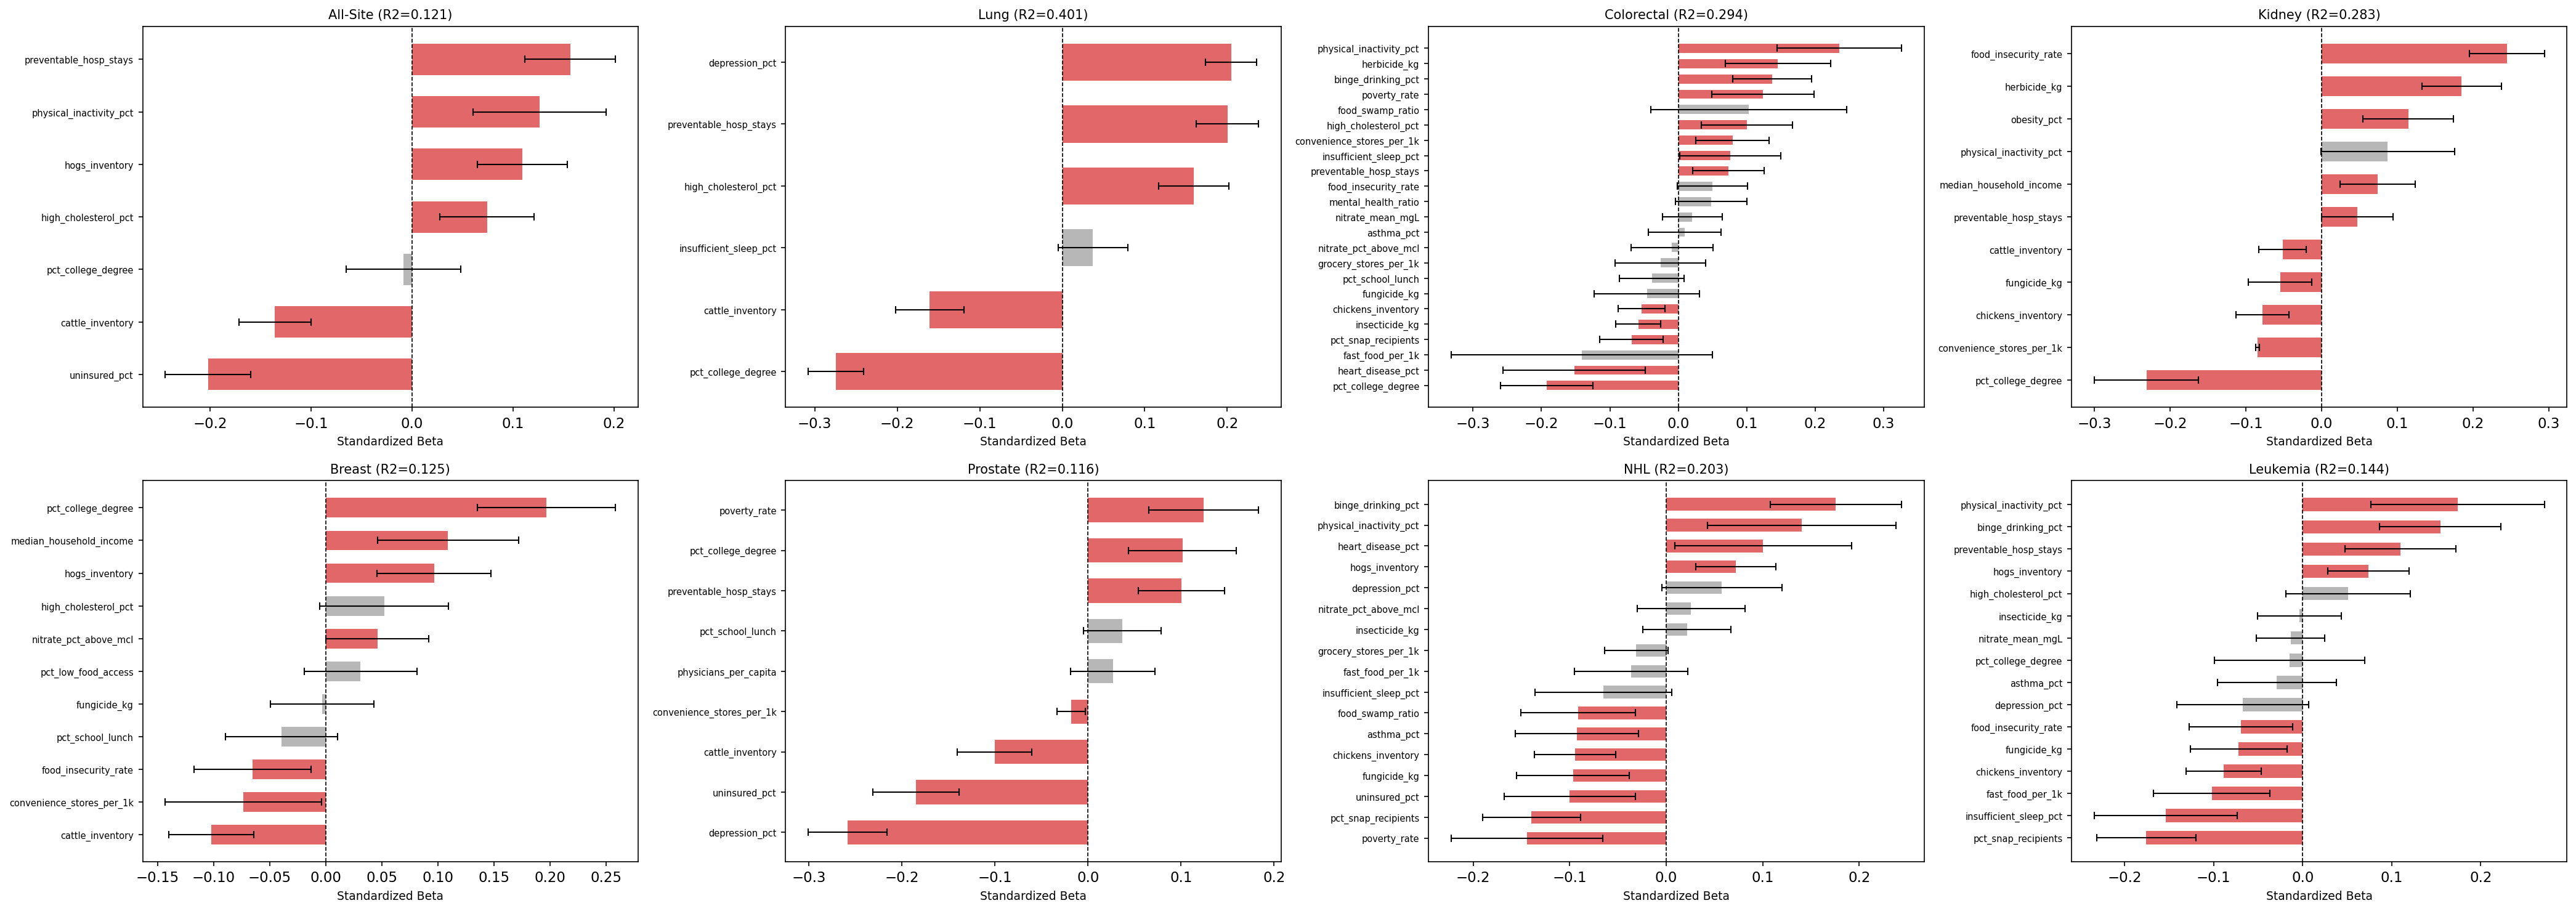
- OLS regression with all significant predictors
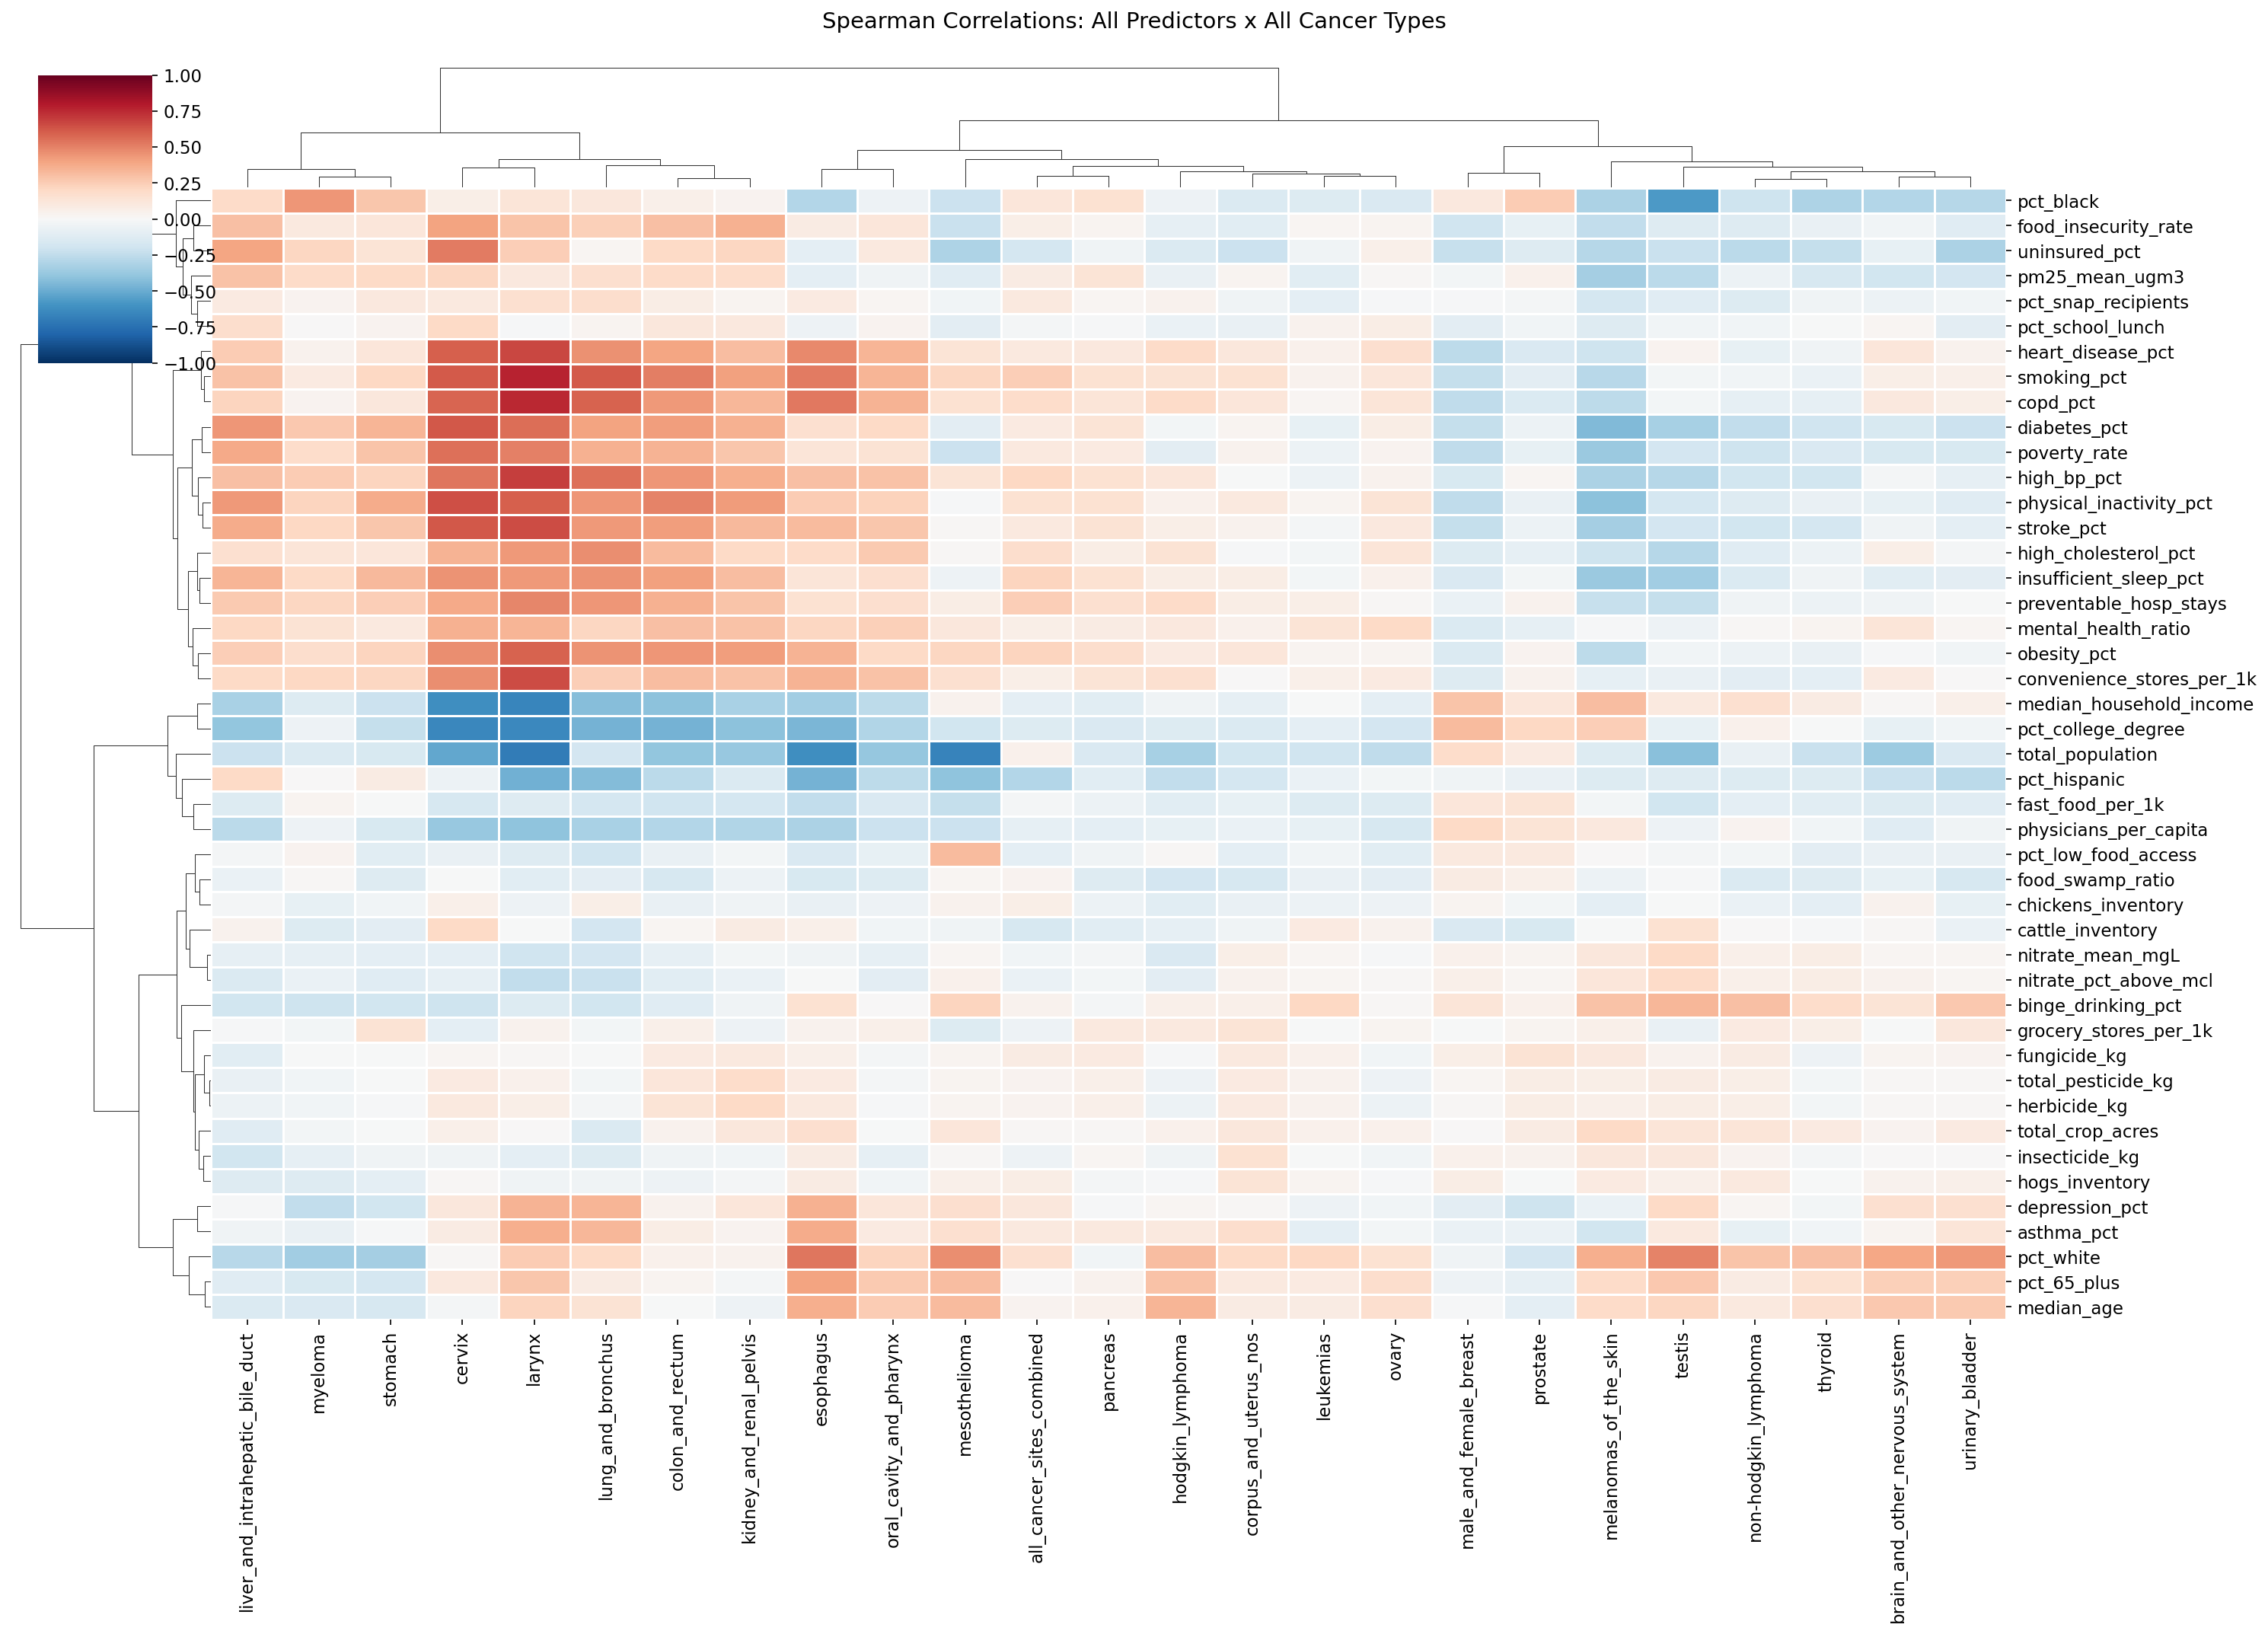
Predictor–Cancer Correlation Heatmap
Significance Volcano Plot
Top OLS Associations
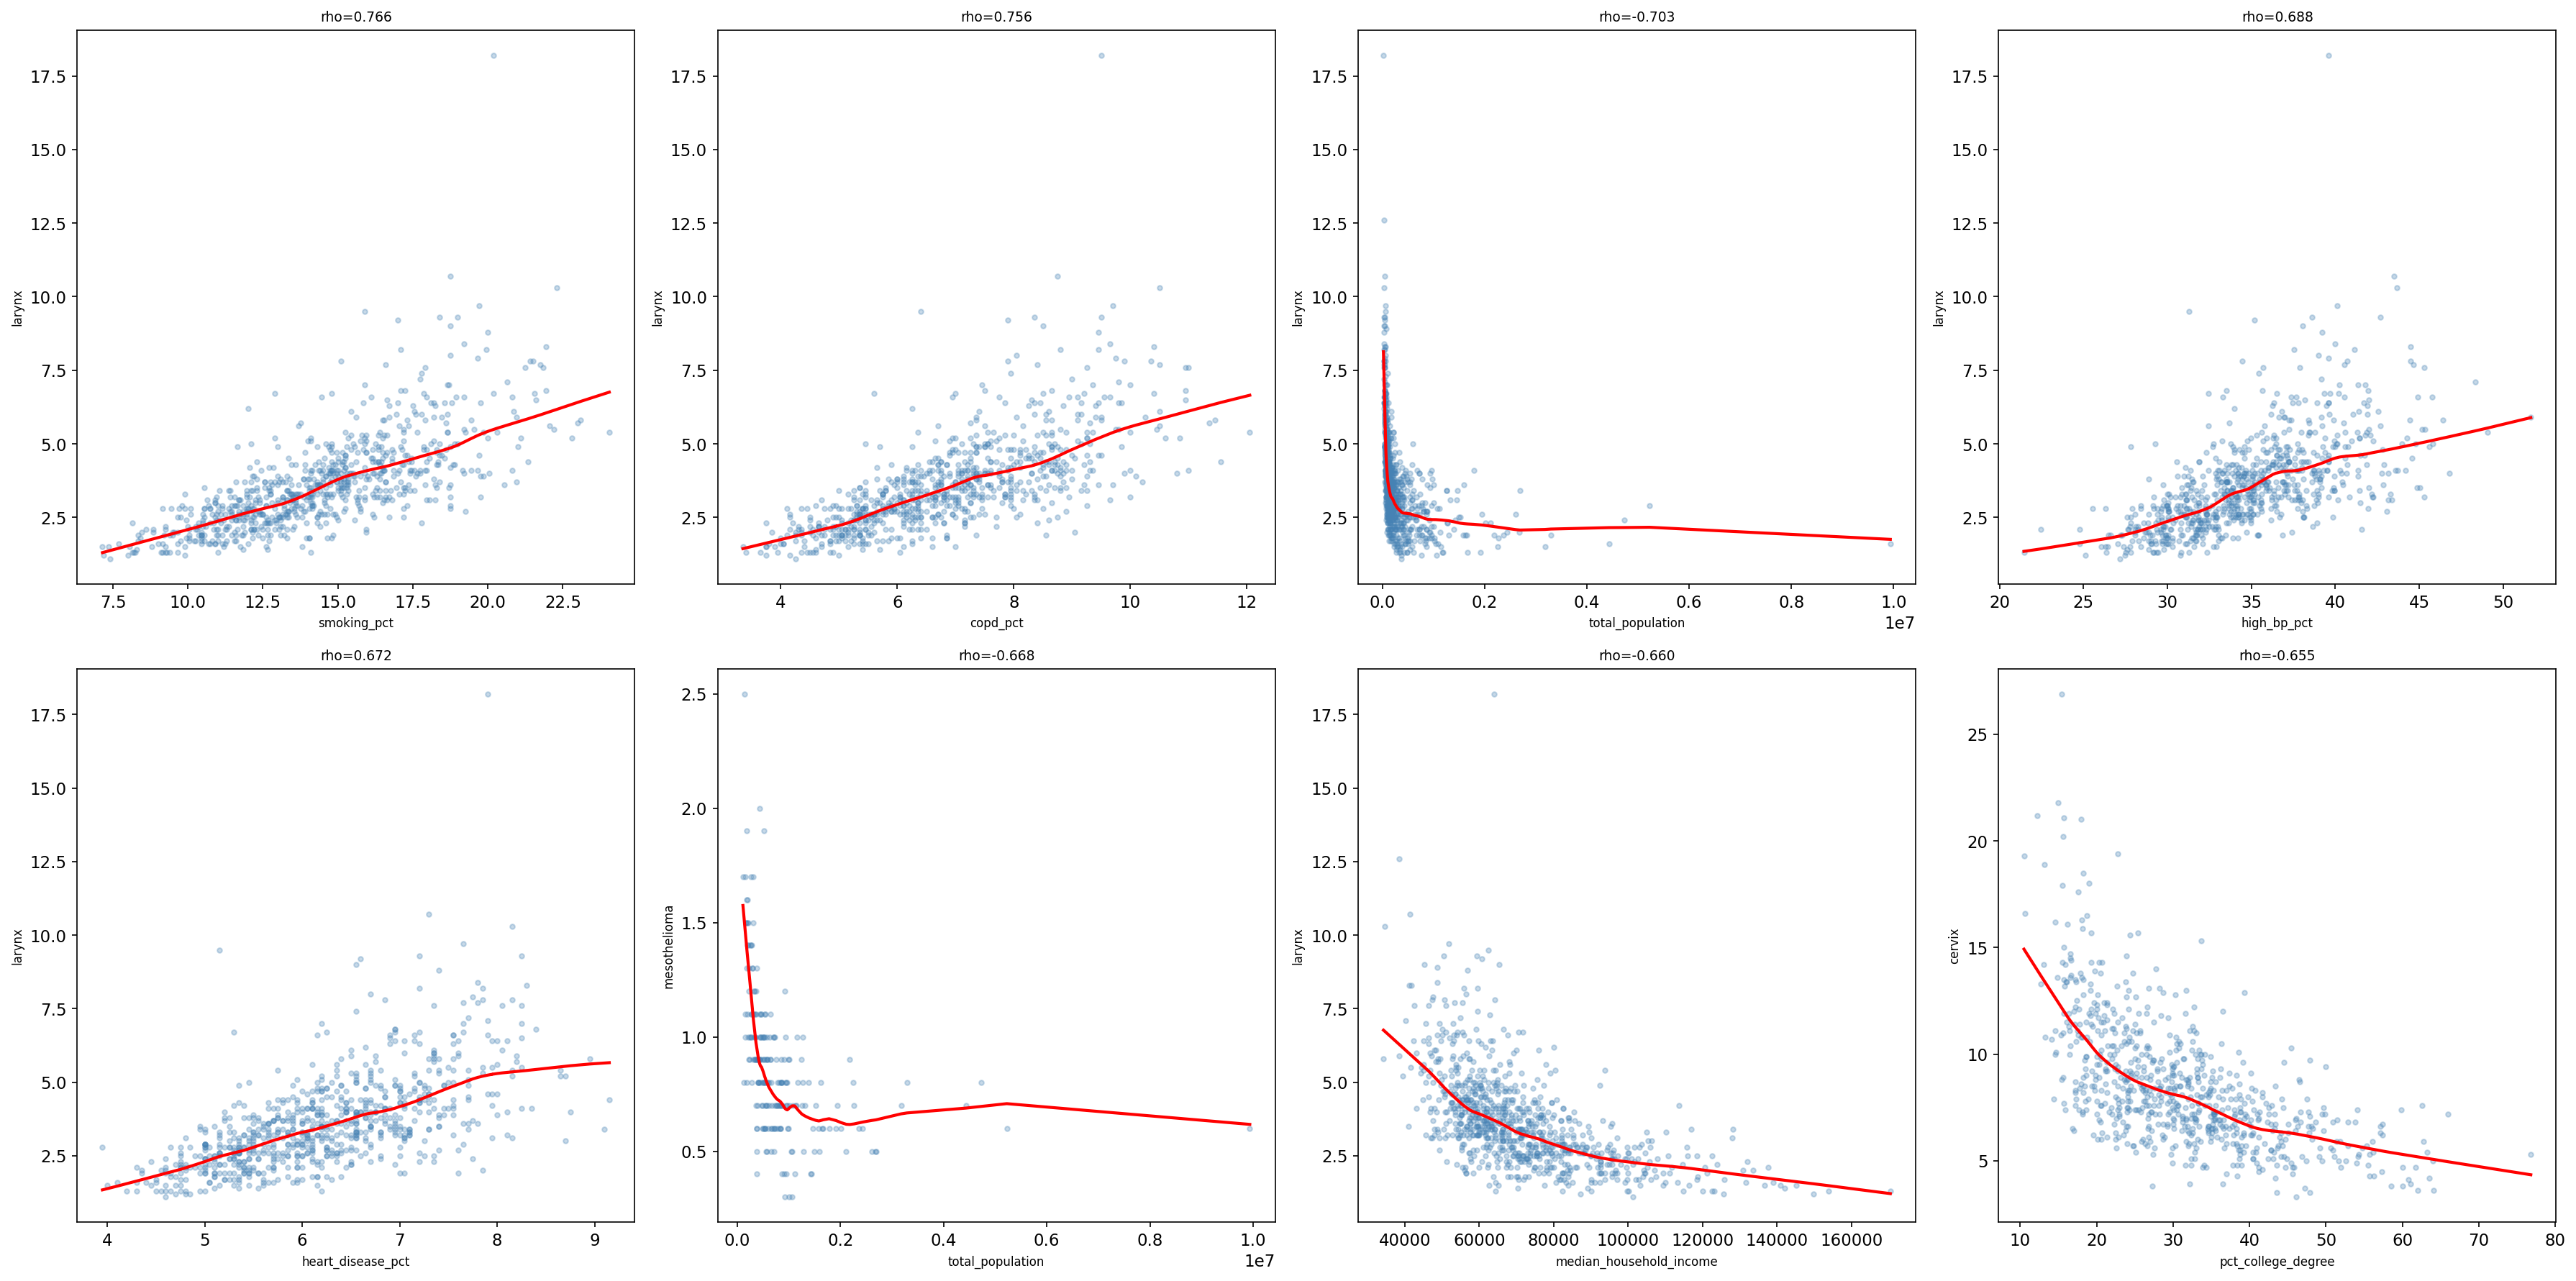
Top 8 Scatter Plots
Synthesis
The full exploratory synthesis table (CSV download) contains all tested predictor–cancer pairs with Spearman rho, FDR-adjusted p-value, partial correlation, LASSO inclusion, and OLS coefficient. The top correlates for each cancer type are in top_correlates_by_cancer.csv.
Key Findings
Expected signals confirmed: Smoking is the dominant predictor for lung, larynx, esophageal,
and oral cancers. Obesity is the strongest predictor for myeloma and endometrial cancers.
Pesticide specificity: Among 26 cancer types, pesticide density shows its strongest
and most consistent associations with kidney and colorectal cancer, matching the hypothesis-driven
BYM2 results. This convergence from hypothesis-free screening strengthens the overall evidence.
See Results for the hypothesis-driven analysis and Gauntlets for risk factor head-to-head comparisons.