Cross-Gauntlet Summary
Four risk factors were tested as primary exposures. Smoking passes convincingly (7/8 IARC-linked cancers significant). The other three show mixed results. Crucially, the pesticide–kidney and pesticide–colorectal associations survive as covariates across all four gauntlets.
| Gauntlet | IARC Score | Best Hit | Pest → Kidney | Pest → Colorectal | IV F-stat |
|---|---|---|---|---|---|
| Smoking | 7/8 PASS | Larynx RR=1.205* | 1.025* | — | 16.3 |
| Obesity | 4/8 MIXED | Myeloma RR=1.081* | 1.025* | 1.015* | 6.4 (weak) |
| Alcohol | 2/7 MIXED | Oral Cavity RR=1.044* | 1.025* | 1.015* | 3.6 (weak) |
| Inactivity | 2/7 MIXED | Liver RR=1.085* | 1.025* | 1.015* | 25.9 (strong) |
Individual Gauntlet Results
Smoking Gauntlet
Smoking is the strongest positive control: 7 of 8 IARC smoking-linked cancers show significant BYM2 associations. Lung (RR=1.192), larynx (RR=1.205), esophagus (RR=1.139), oral cavity (RR=1.133), bladder (RR=1.117), and kidney (RR=1.067) are all significant. This validates the BYM2 pipeline’s ability to detect known carcinogens.
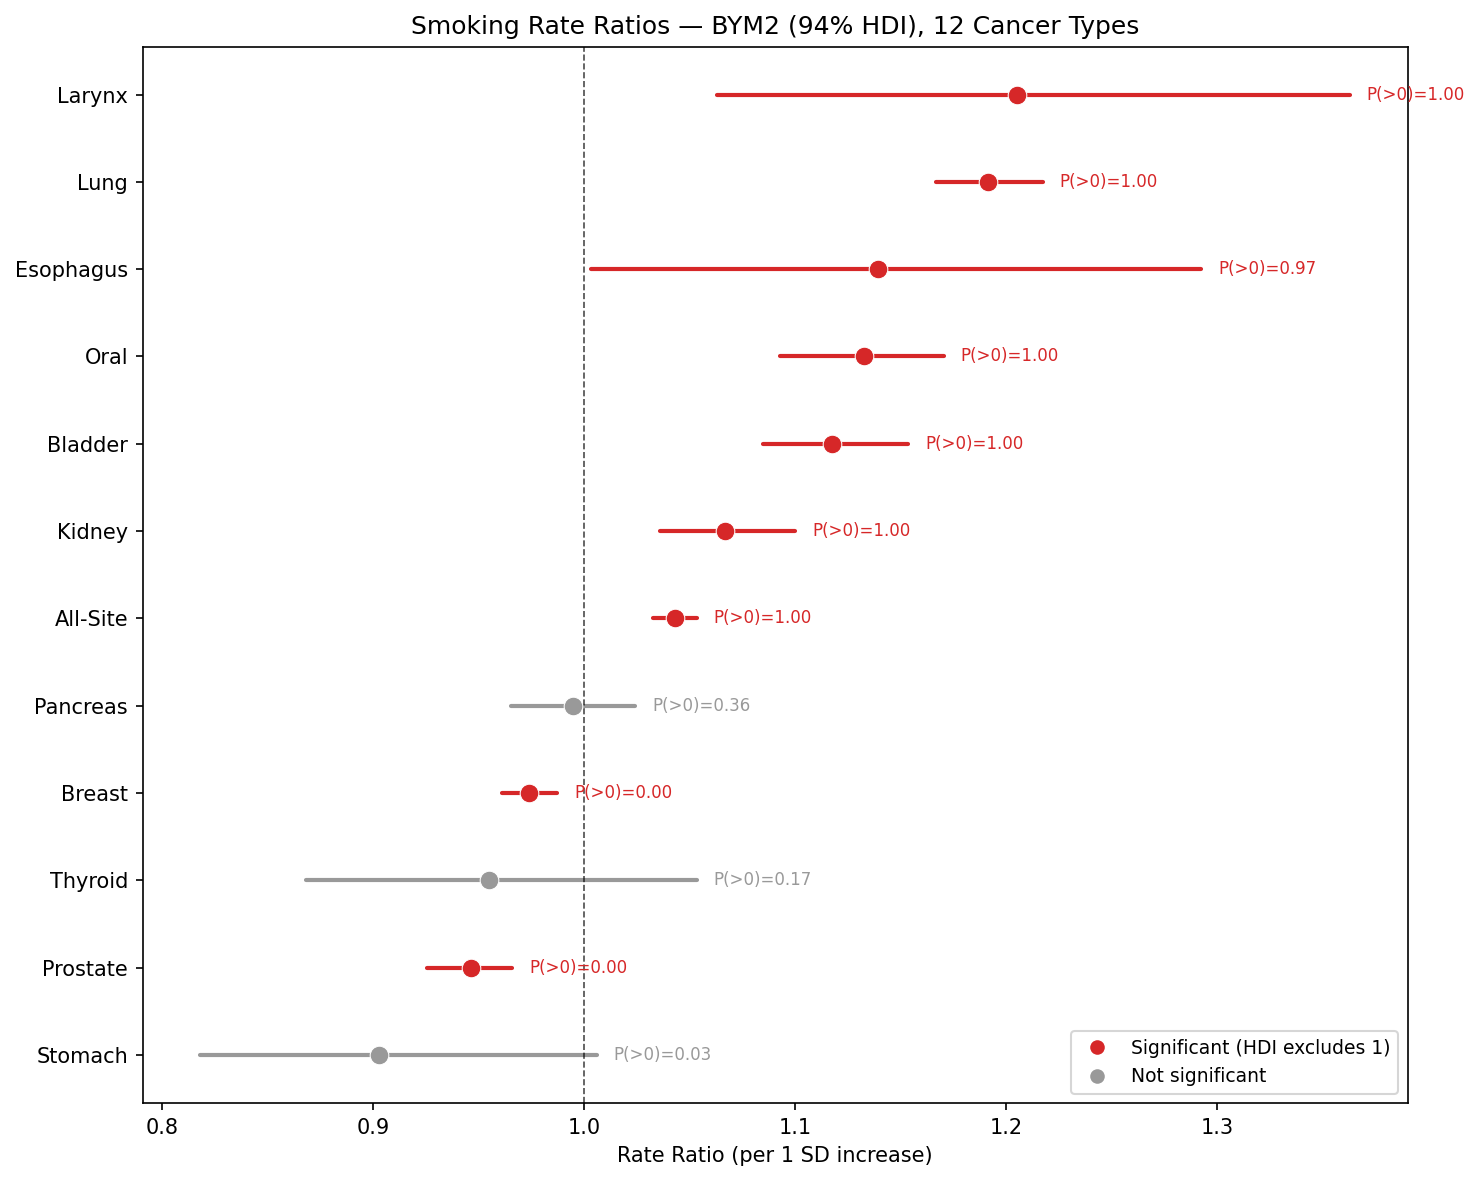
- BYM2: 12 models converged. Lung RR=1.192*, Larynx RR=1.205*, Esophagus RR=1.139*
- Long-difference: Uses change in smoking prevalence. All 7 outputs generated.
- IV/2SLS: Instruments = convenience stores per 1k, fast food per 1k. Mean F=16.3.
- Negative controls: Breast RR=0.974* (inverse), Prostate RR=0.946* (inverse)
Key Takeaway
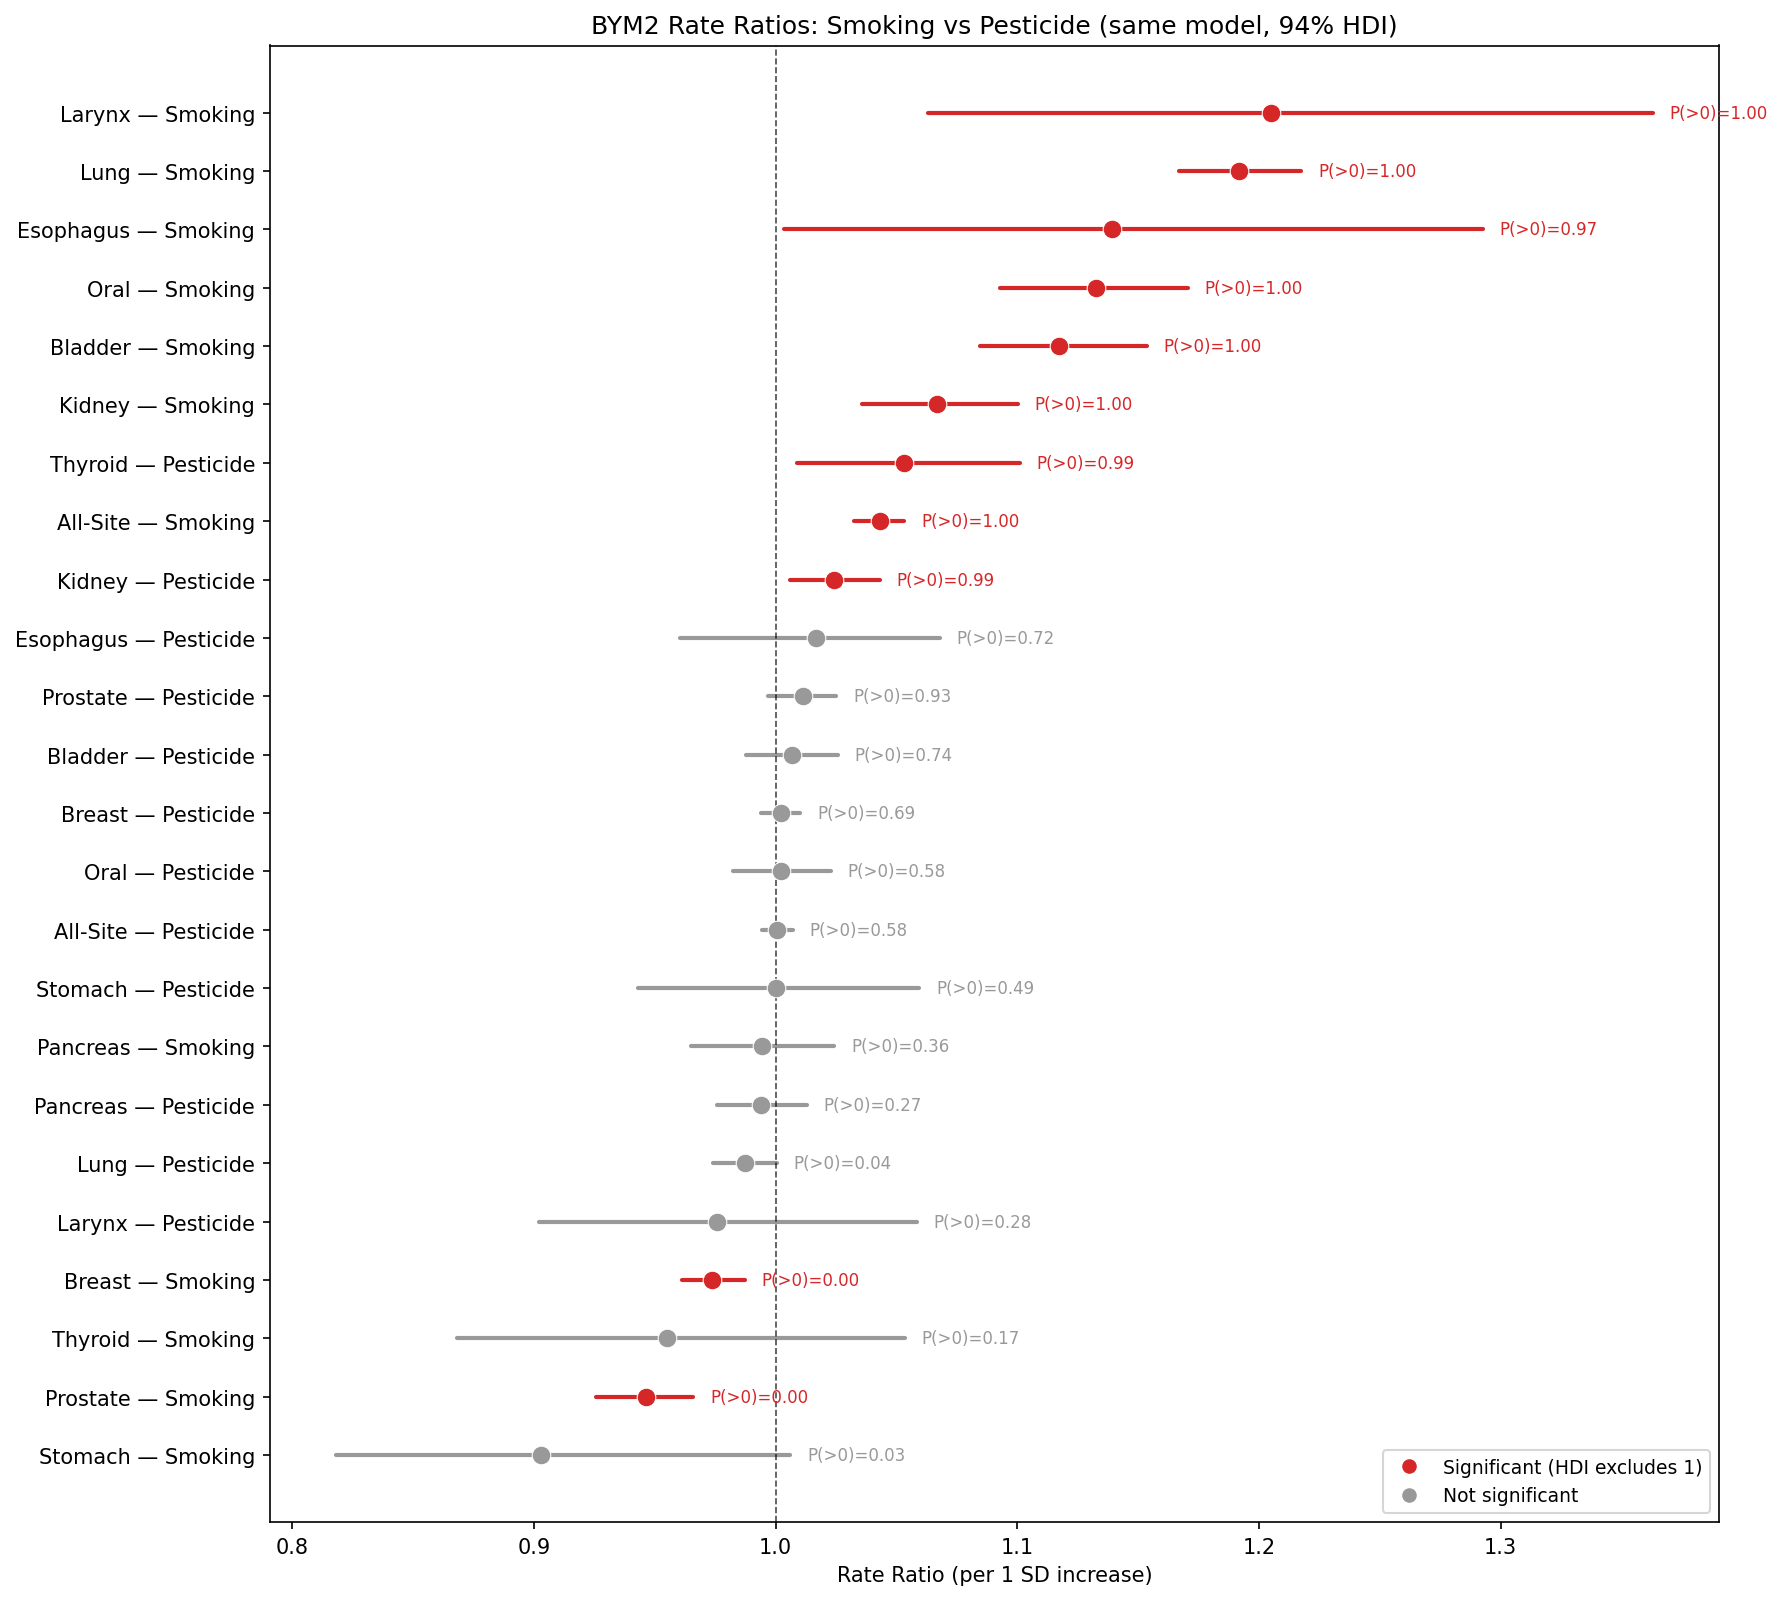
Smoking passes the gauntlet convincingly, validating the analytical pipeline. The pesticide–kidney association (RR=1.025*) survives in the same models.
Obesity Gauntlet
Obesity shows a mixed IARC scorecard: 4 of 8 linked cancers are significant. The strongest signal is myeloma (RR=1.082*). Kidney shows both obesity (RR=1.036*) and pesticide (RR=1.026*) significant in the same model, suggesting independent risk pathways. Colorectal shows pesticide-only (obesity NS).
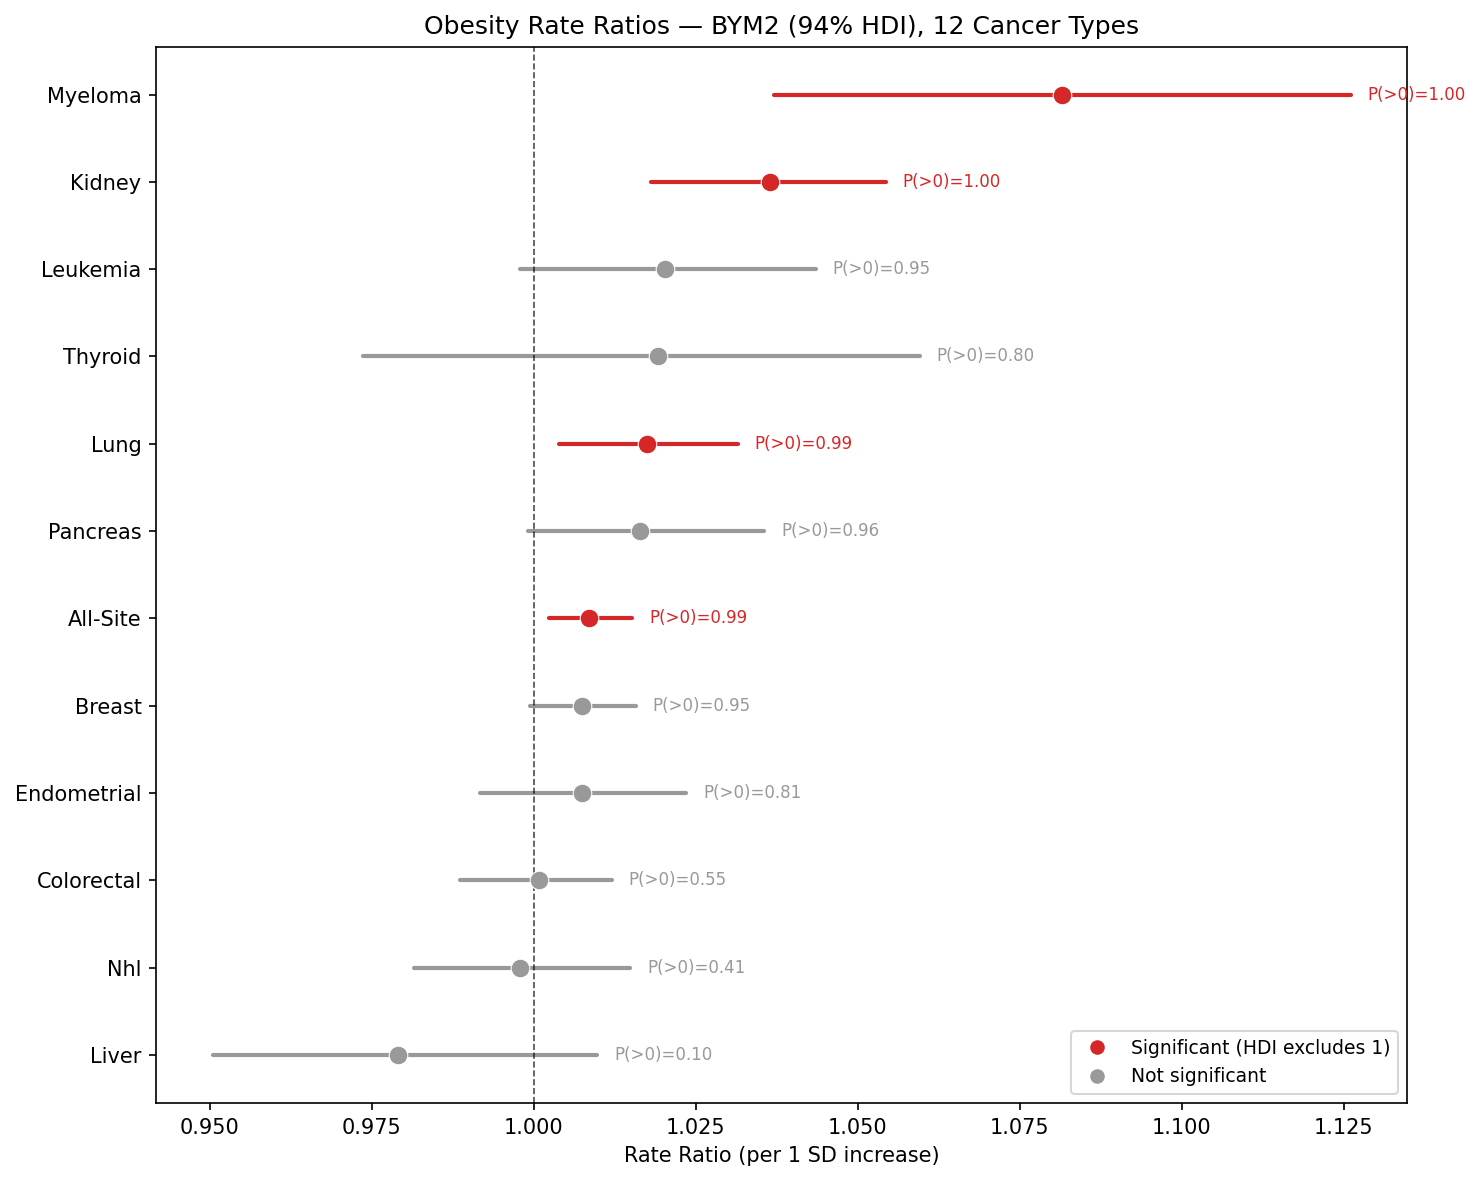
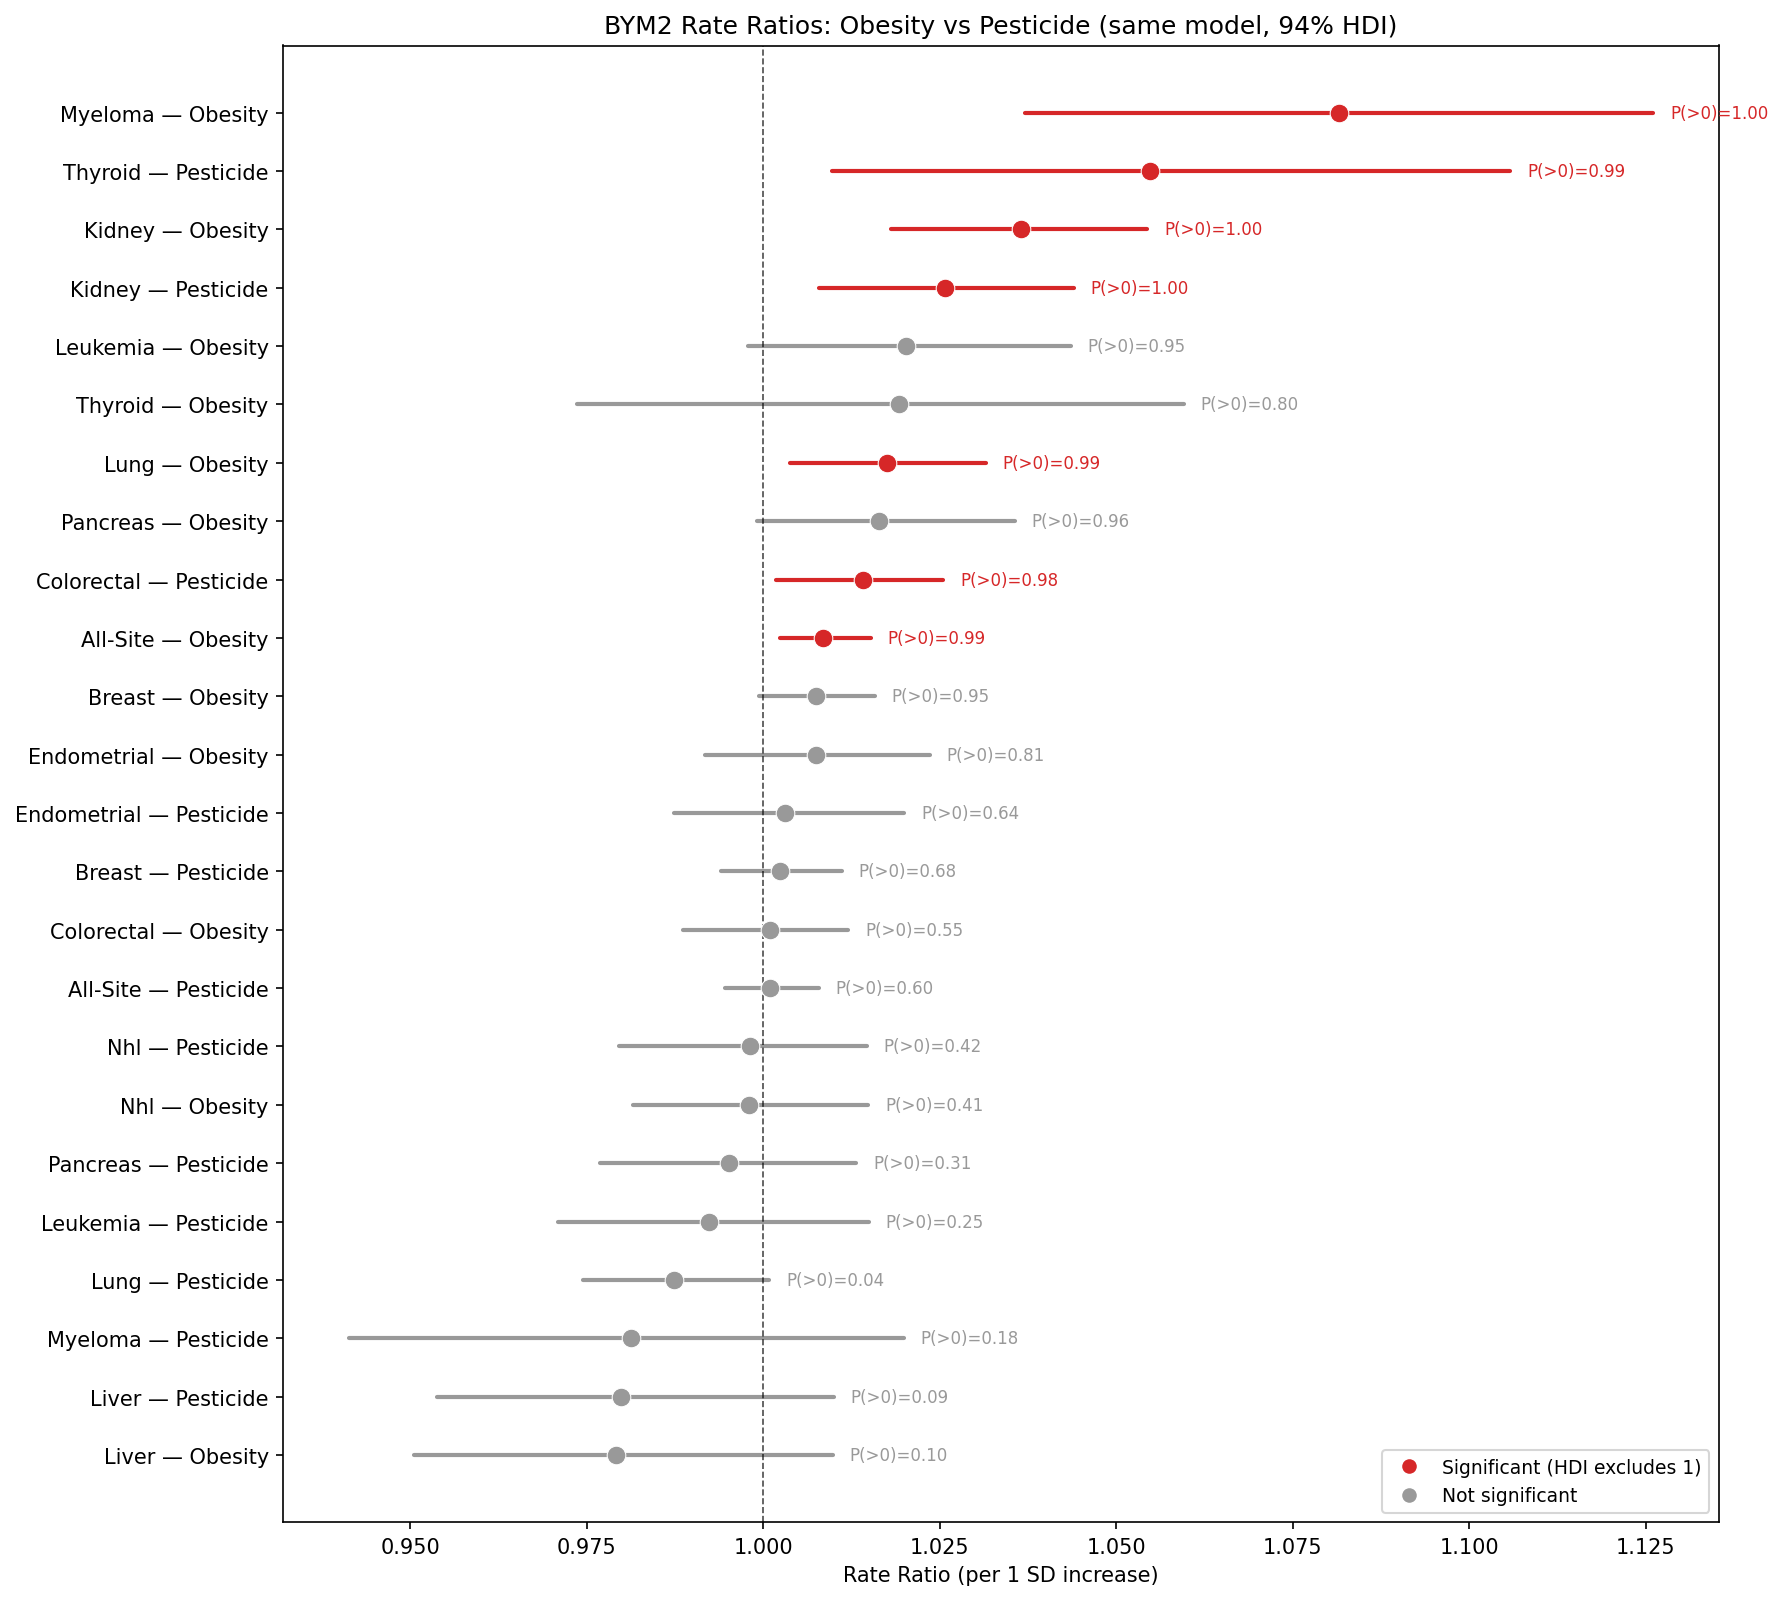
- BYM2: 12 models, max Rhat=1.09. Kidney: Obesity RR=1.036* + Pesticide RR=1.026*
- Long-difference: Only kidney significant (β=0.142, p<0.0001)
- IV/2SLS: Food environment instruments (grocery stores, food swamp ratio, low food access). Mean F=6.4 — WEAK instruments
- Key: Colorectal is pesticide-specific (obesity NS in BYM2)
Key Takeaway
Kidney cancer has independent associations with both obesity and pesticide exposure. Colorectal cancer is associated with pesticide only—obesity does not explain the colorectal signal.
Alcohol Gauntlet
Alcohol shows only 2 of 7 IARC-linked cancers significant in BYM2. Only oral cavity (RR=1.044*) is clearly positive. Long-difference results are stronger (8/12 significant), but IV instruments are very weak (F=3.6). The pesticide–colorectal association survives (alcohol is NS for colorectal in BYM2).
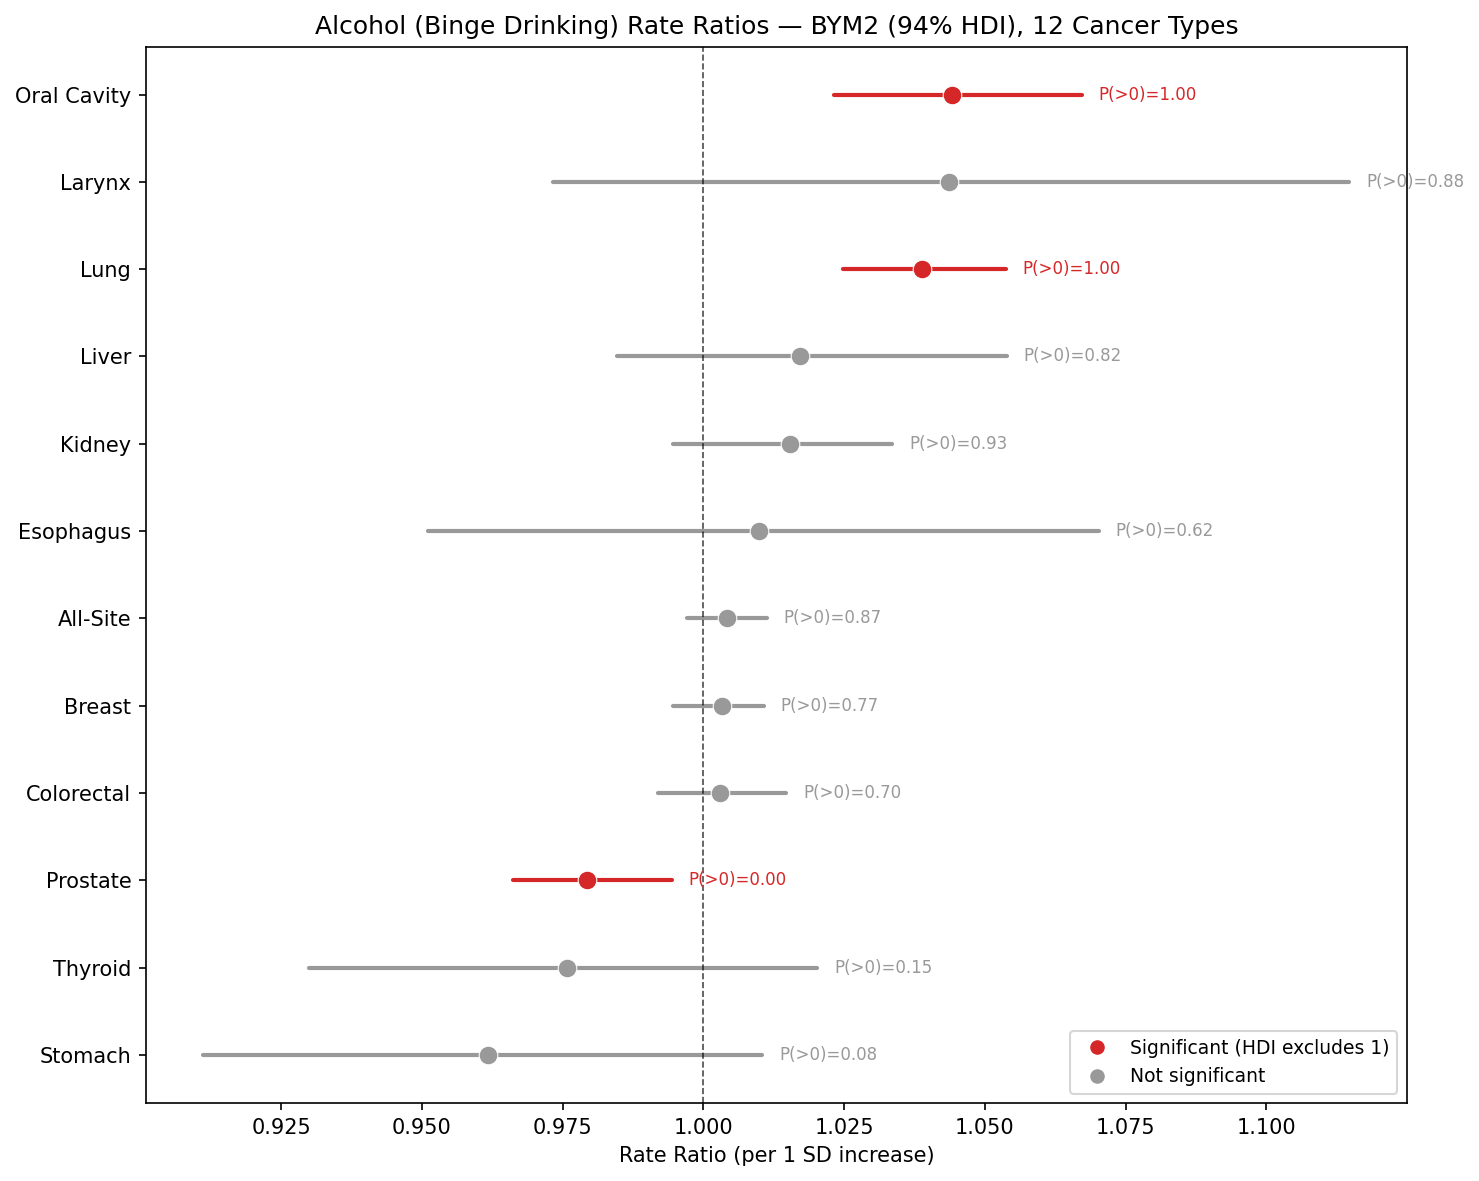
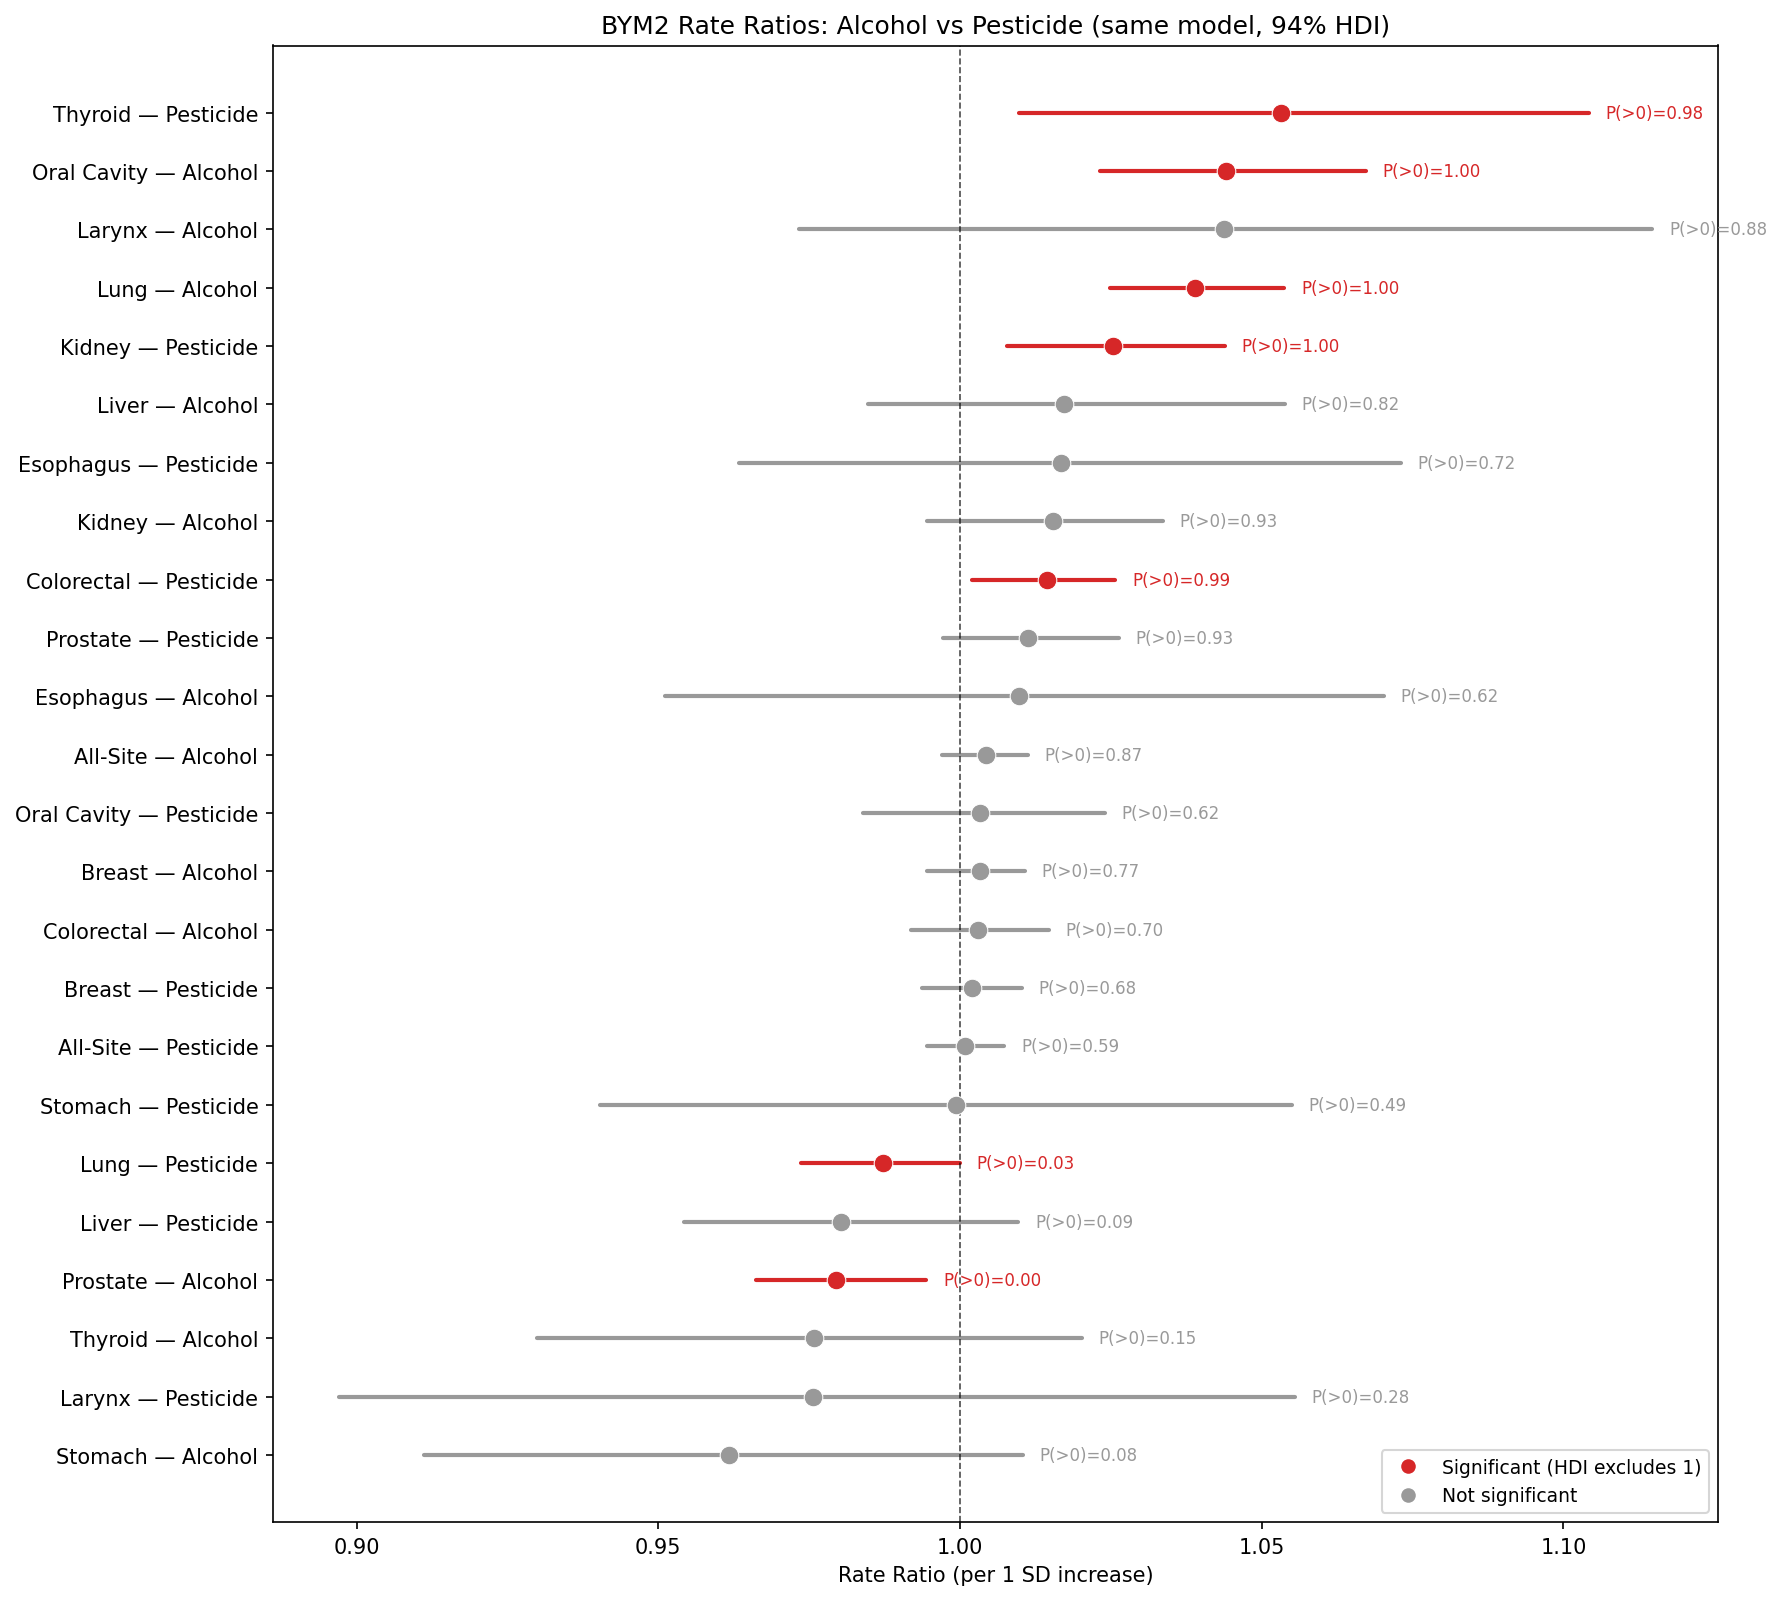
- BYM2: Only Oral Cavity sig (RR=1.044*). Colorectal NS (RR=1.003), Liver NS (RR=1.017)
- Long-difference (7yr): 8/12 sig — Breast β=0.177***, Oral, Larynx, Liver, Colorectal, Kidney, Prostate, All-Site. Lung NS (good negative control)
- IV/2SLS: Mean F=3.6 — VERY WEAK instruments. Results unreliable.
- Negative control failure: Lung RR=1.039* (unexpected positive in BYM2)
Key Takeaway
Alcohol does not explain the pesticide–colorectal signal. Alcohol is null for colorectal in BYM2 while pesticide remains significant.
Physical Inactivity Gauntlet
Physical inactivity shows only 2 of 7 IARC-linked cancers significant: colorectal (RR=1.031*) and liver (RR=1.085*). IV instruments are the strongest of any gauntlet (F=25.9, using RUCC + population density). Inactivity does not outperform obesity as a metabolic driver. Pesticide associations survive.
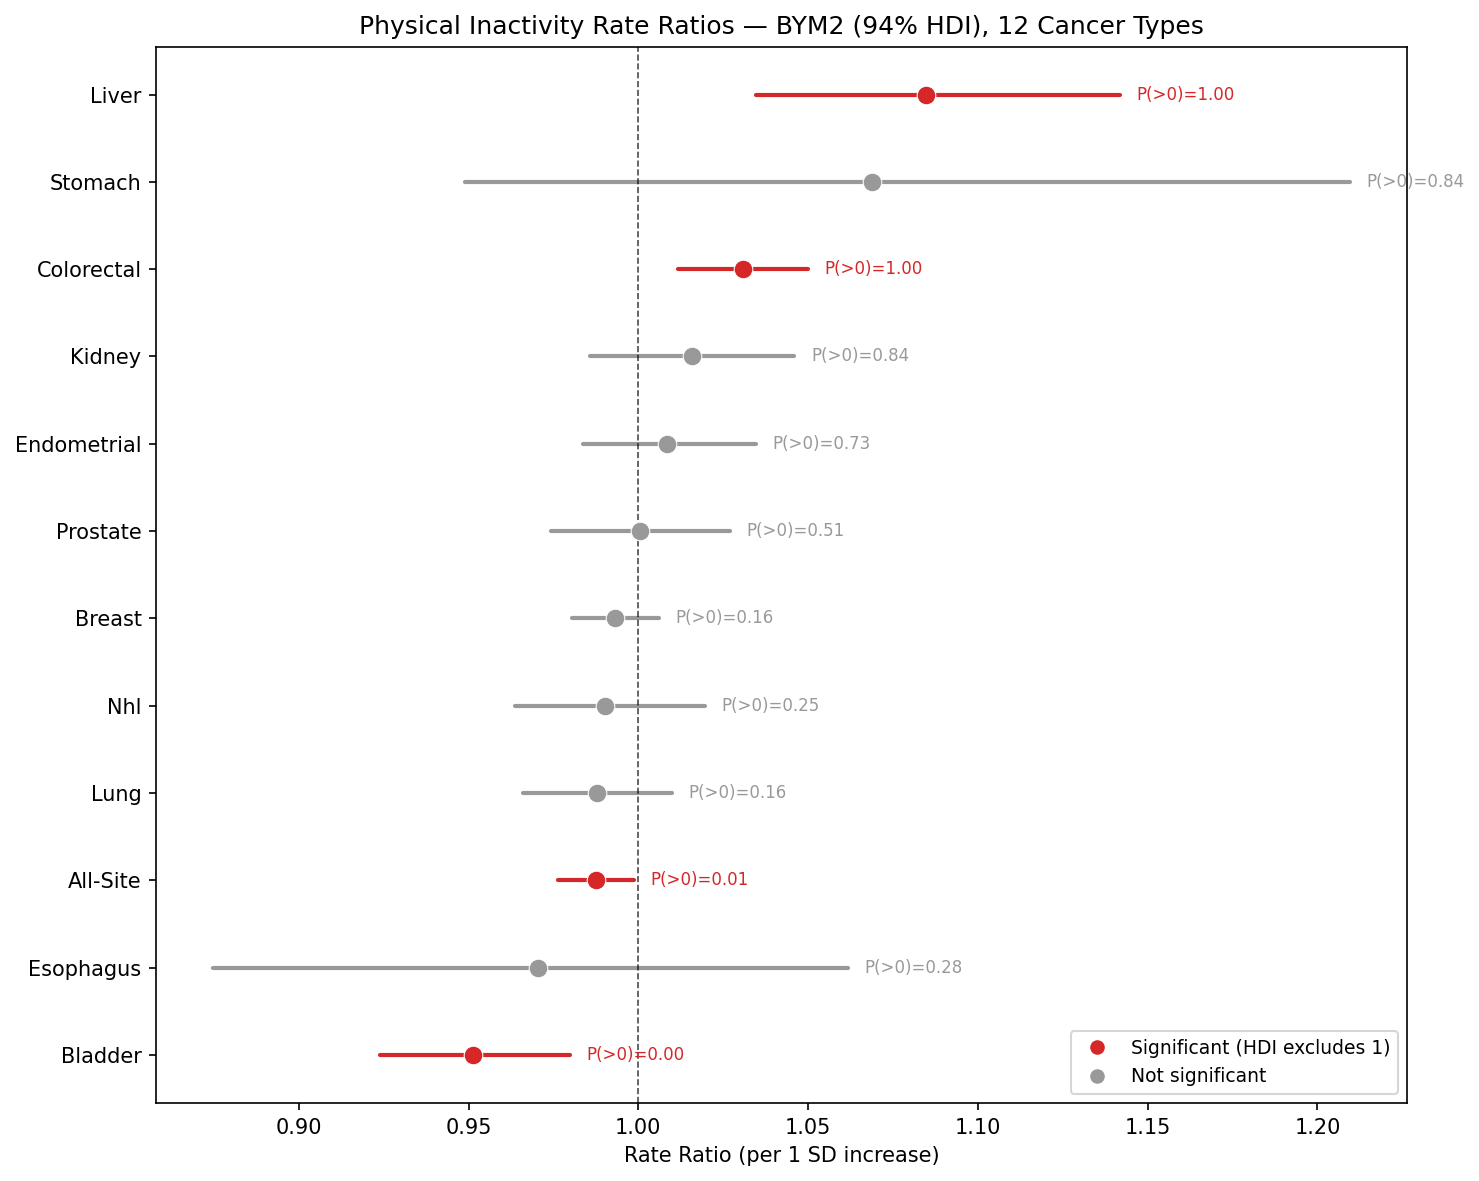
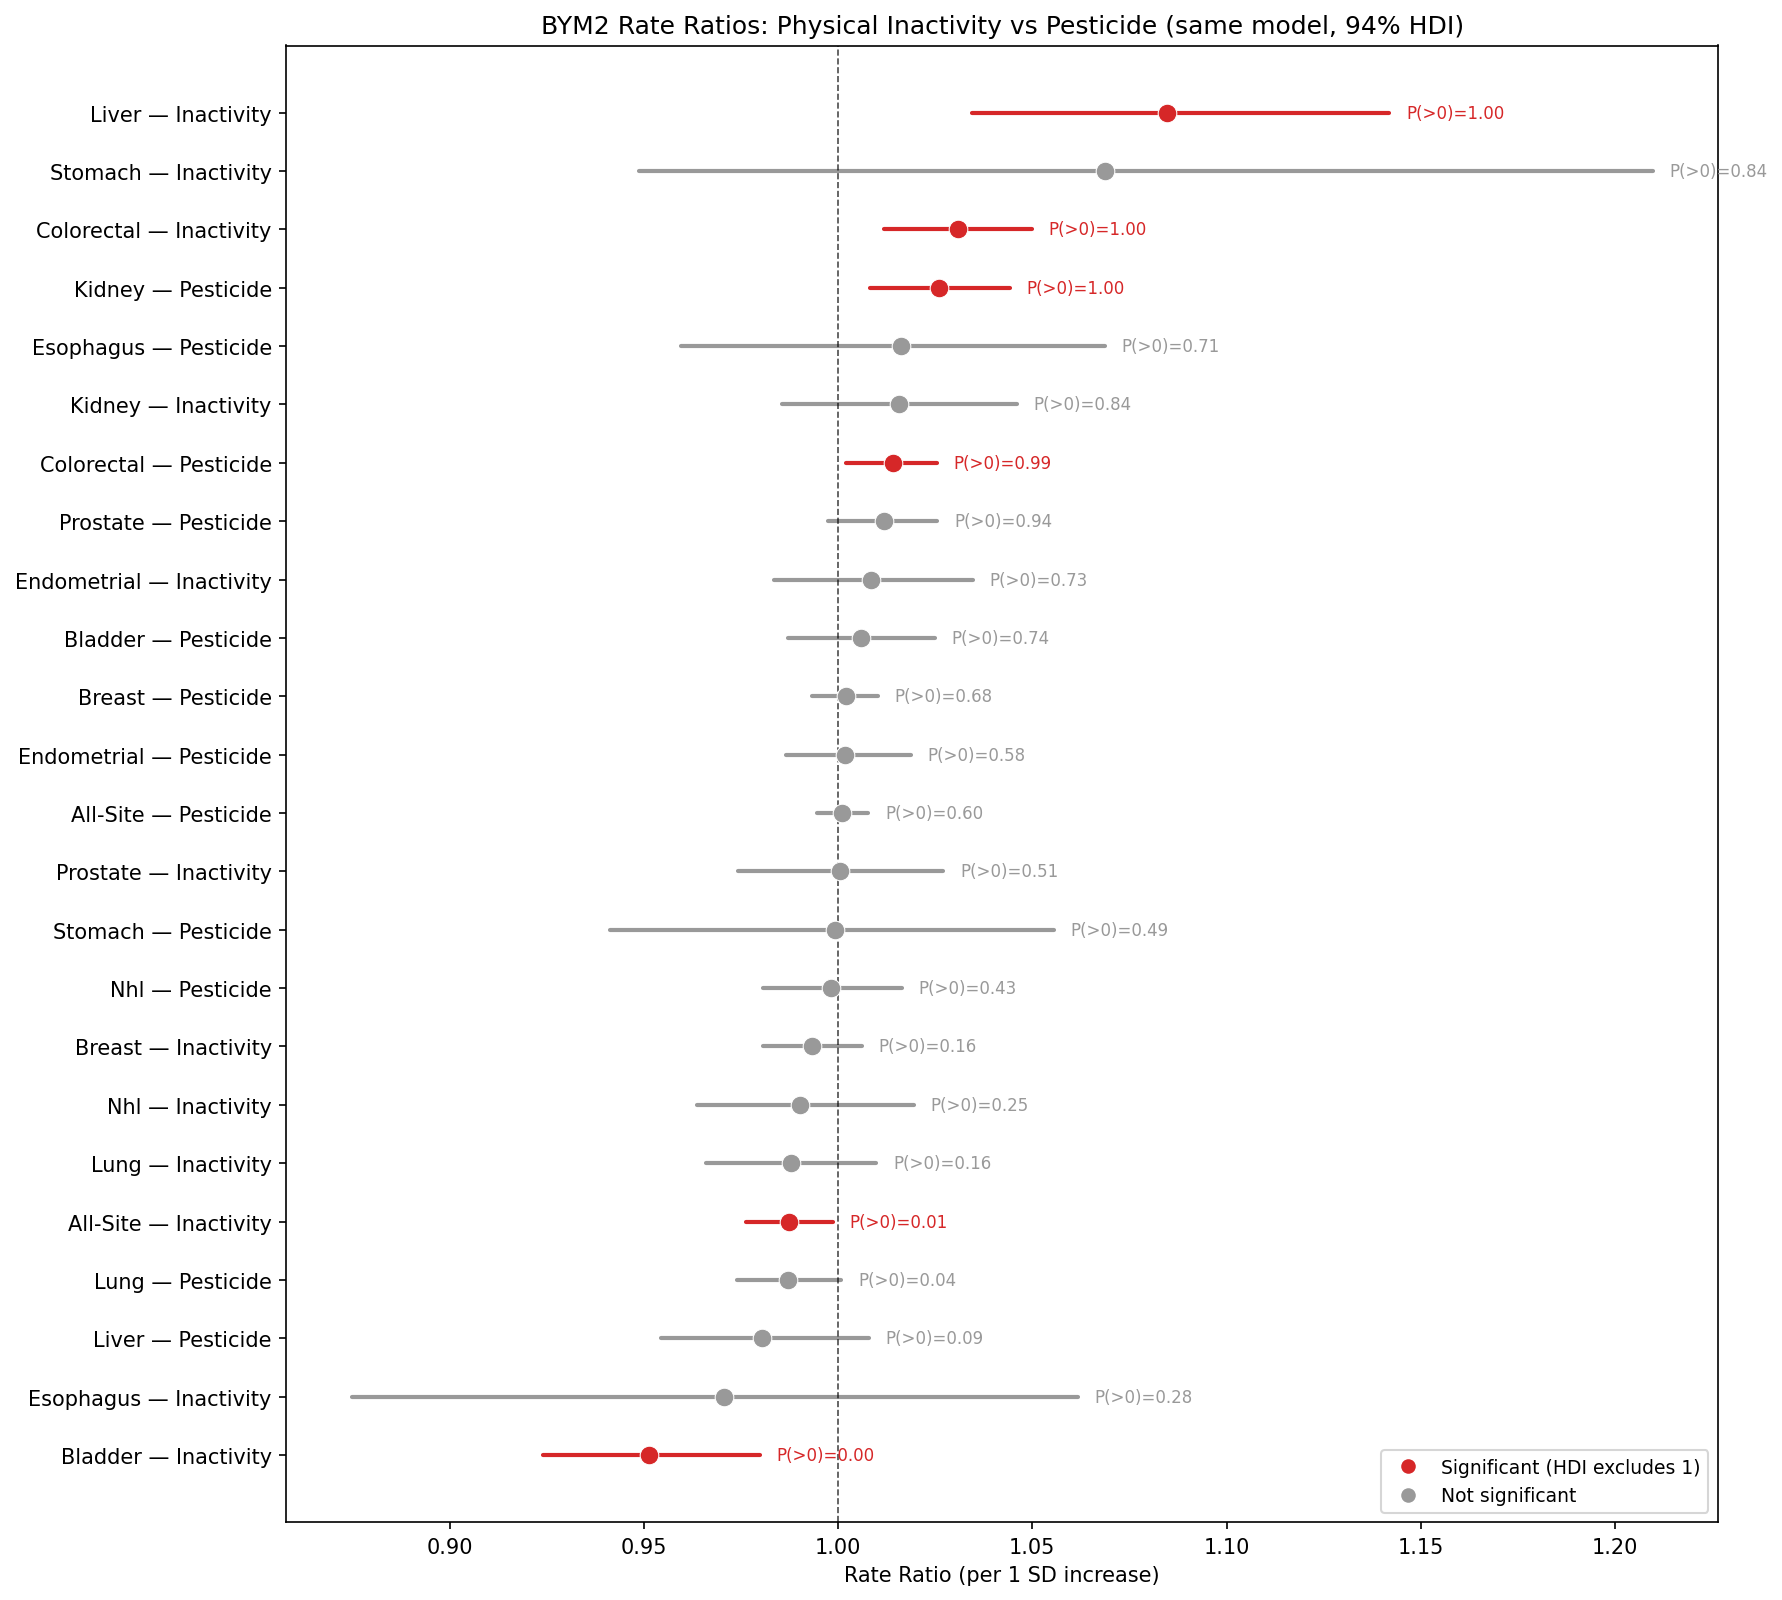
- BYM2: Only Colorectal sig (RR=1.031*). Kidney NS (RR=1.016). Bladder inverse (RR=0.951*)
- Long-difference (7yr only): Colorectal sig (β=0.131***), also Stomach, Liver, Lung
- IV/2SLS: RUCC + pop_density instruments. Mean F=25.9 (STRONG). Colorectal sig (p=0.025)
- Key: Inactivity does NOT outperform obesity as metabolic driver
Key Takeaway
Inactivity has strong IV instruments but weak IARC scorecard. Pesticide–kidney and pesticide–colorectal both survive independently.
Synthesis
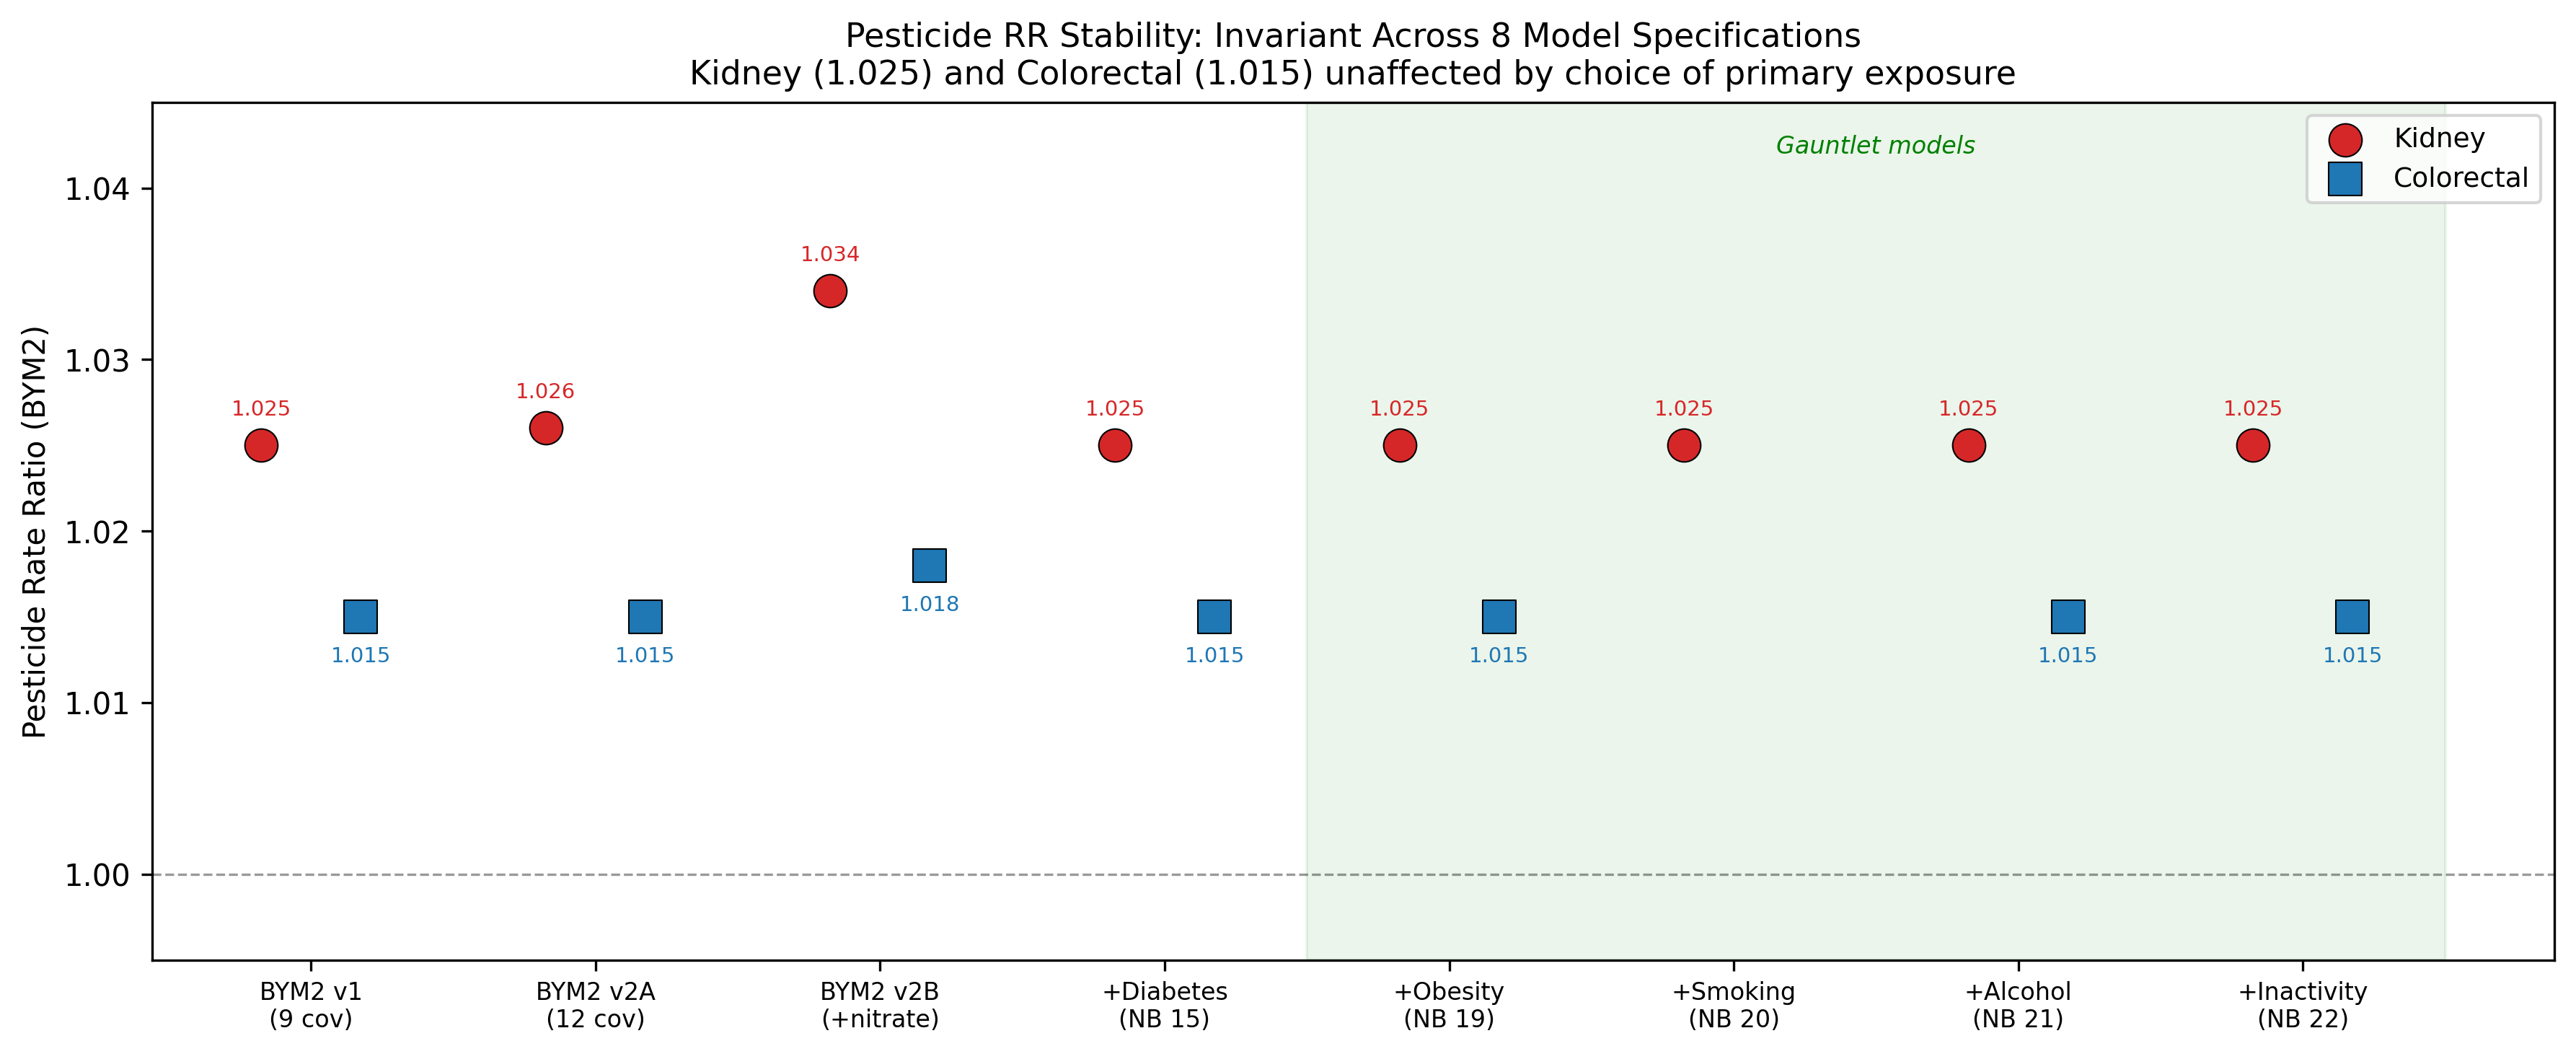
Pesticide Associations Survive All Four Gauntlets
The pesticide–kidney (RR=1.025) and pesticide–colorectal (RR=1.015) associations remain significant as covariates regardless of which established risk factor is modeled as the primary exposure. This rules out the hypothesis that the pesticide signal is merely a proxy for smoking, obesity, alcohol, or physical inactivity. The associations appear to represent an independent environmental risk pathway.
Gauntlet result CSVs available on the Downloads page. Full methodology described on the Methods page.