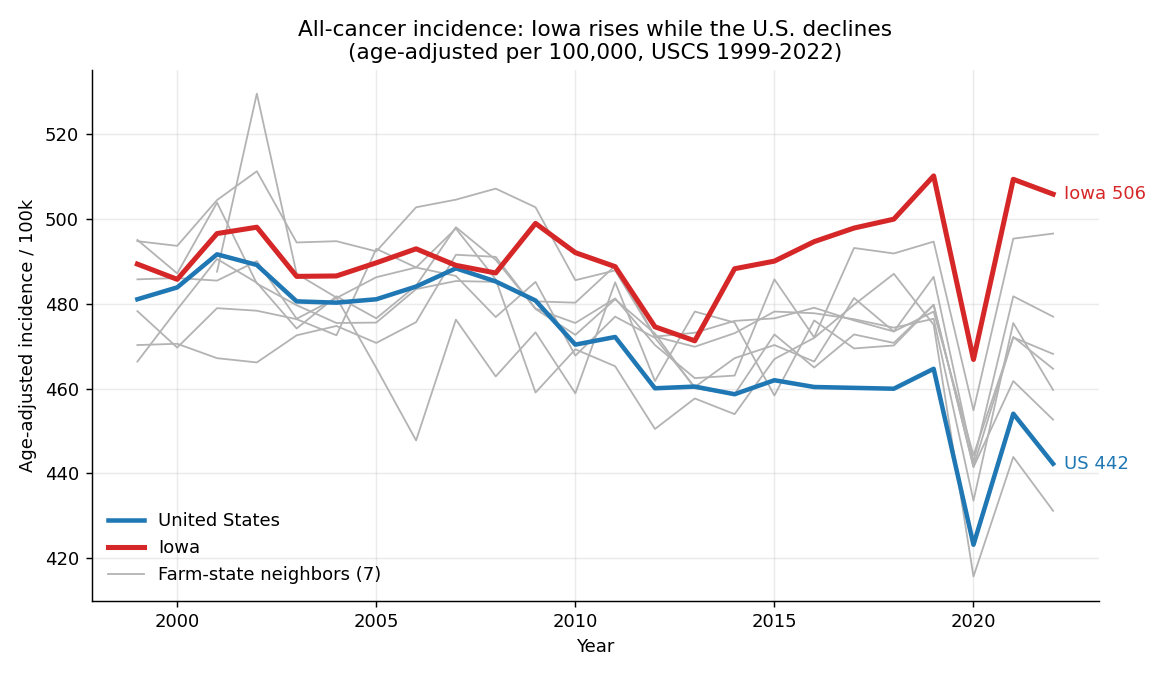
It's a divergence, not a surge
Iowa's age-adjusted all-cancer incidence is essentially flat since 1999 (+0.06%/yr). What changed is the nation: U.S. incidence fell about 5% (−0.34%/yr, p<0.001). Iowa simply stopped following the national decline, so the gap widened — from +8 per 100,000 above the U.S. in 1999 to roughly +45–64 by 2019–2022. This matches the registry's own “~0.7%/yr, leveling off, partly post-COVID screening rebound” framing — not the “skyrocketing” of headlines.
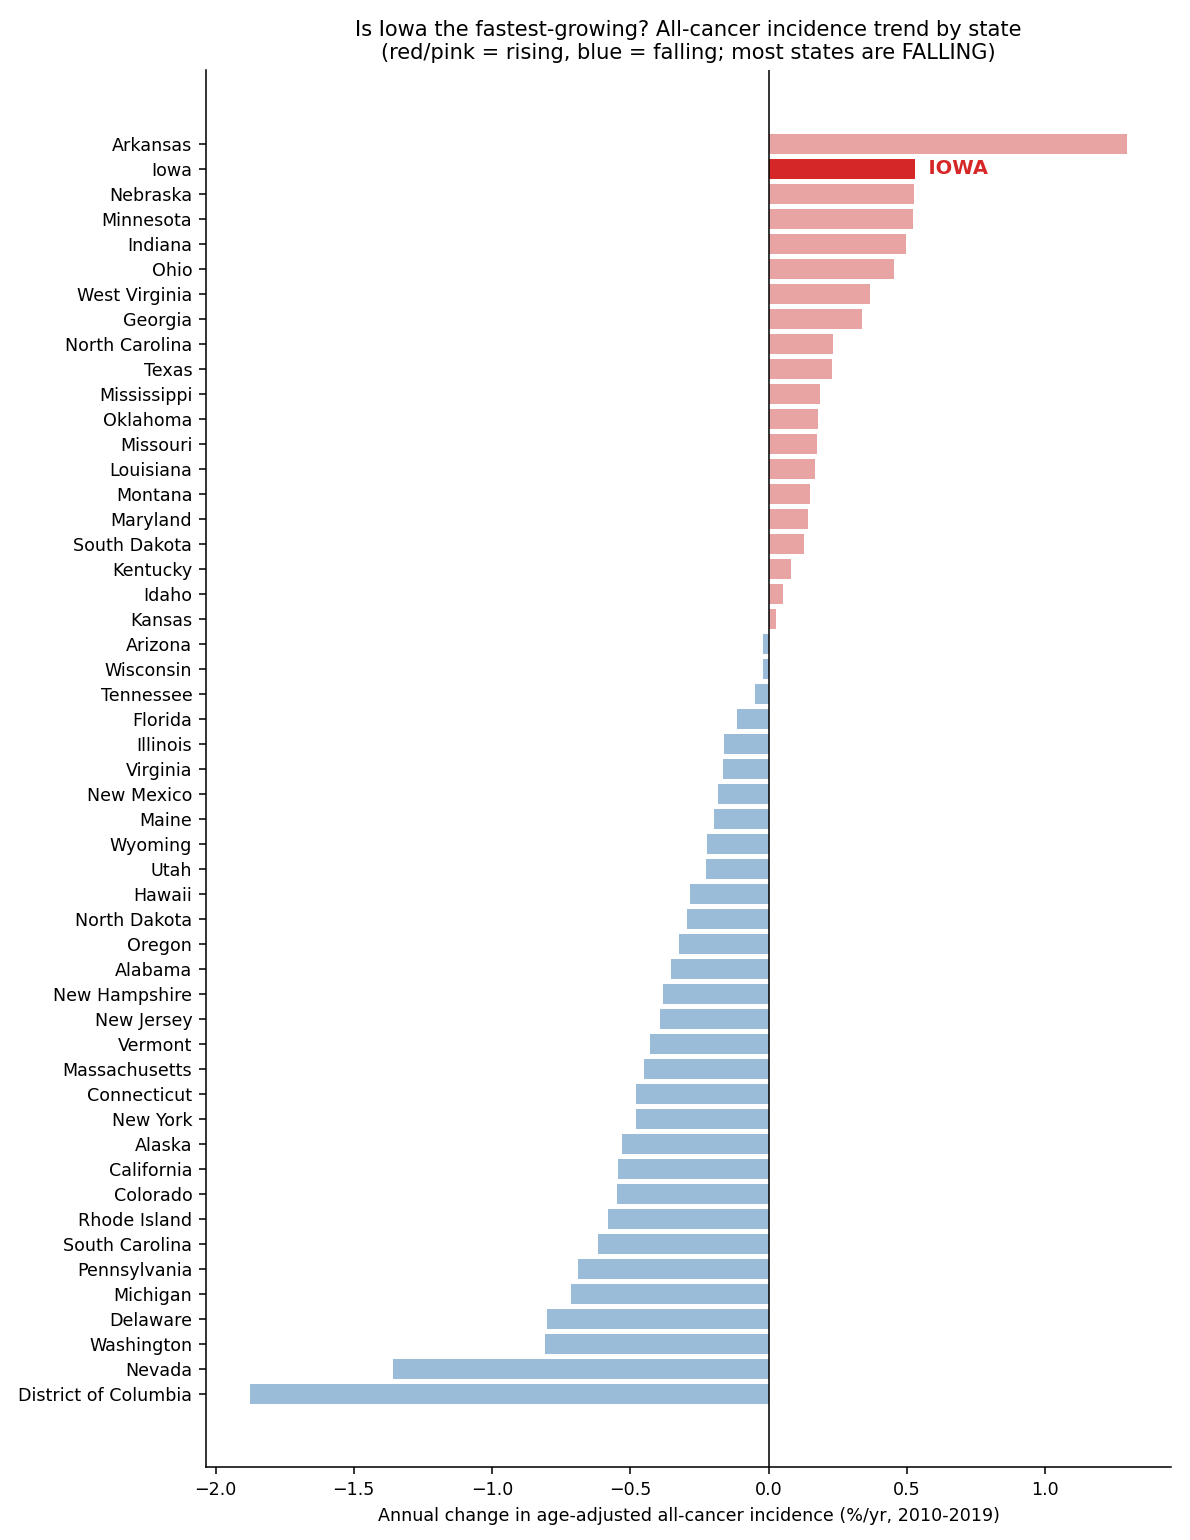
Is Iowa really the “fastest-growing”? Among credible registries, plausibly yes
We independently re-ranked all 50 states + DC by their cancer-incidence trend under 16 different metric/window combinations. Iowa is literally #1 in zero of them — its rank ranges from #2 to #8 (median #3). The honest statement is that Iowa is among the 2–3 fastest-growing states, and one of only ~7 states whose age-adjusted rate is rising at all while most states fall (the sea of blue below).
Why “THE fastest” overstates it — and why Iowa is still the most credible riser
Arkansas tops the pre-COVID window (+1.3%/yr, ~2.4× Iowa) but collapses to negative in any window reaching 2020–2022 — and its rise is partly a registry artifact: Arkansas was officially excluded from U.S. Cancer Statistics for failing federal quality criteria as recently as diagnosis year 2010 (CDC/MMWR), so a chunk of its “increase” is case-counting catch-up. Iowa, by contrast, has been a gold-standard SEER registry since 1973 with ≥95% completeness — so among stable, high-quality registries, Iowa is the more credible fastest genuine riser. The claim is also age-adjustment-dependent: on crude rates Iowa is mid-pack (#25–33). The Iowa Cancer Registry's own careful wording is conditional — “Only 6 states have rising rates, but Iowa's is rising the fastest” — not an unconditional #1.
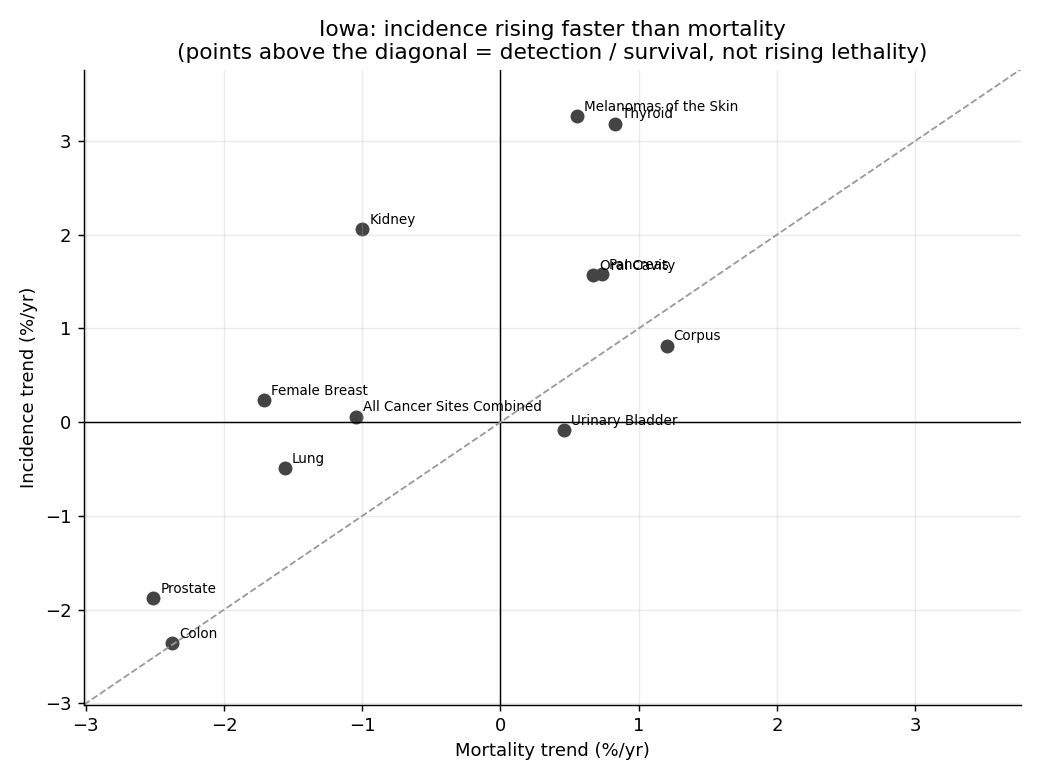
The rising-incidence cancers carry the detection signature
The decisive test: compare incidence trends to mortality trends. When more cancer is found but fewer people die of it, the driver is screening and incidental detection — not a new carcinogen. Across Iowa's rising sites, incidence rises far faster than mortality.
Two honest refinements (from independent verification)
(1) This pattern is national, not Iowa-specific. The same incidence-over-mortality divergence appears across the U.S. at nearly identical magnitude. So it explains the character of Iowa's rise (detection and survival, not a new carcinogen) — but it does not by itself explain why Iowa sits above the nation. (2) Breast is survival, not overdiagnosis: Iowa breast incidence is essentially flat; its divergence comes from falling mortality (better treatment). Kidney, thyroid and melanoma are the genuine detection cases.
| Site | Incidence %/yr | Mortality %/yr | Interpretation |
|---|---|---|---|
| Kidney | +2.1 | −1.0 | Incidental detection of small renal masses (CT) |
| Thyroid | +3.2 | +0.8 | Classic overdiagnosis |
| Melanoma | +3.3 | +0.6 | Detection + real UV/sun exposure |
| Female breast | +0.2 | −1.7 | Mammography + better treatment |
| All cancer | +0.1 | −1.0 | Becoming more survivable |
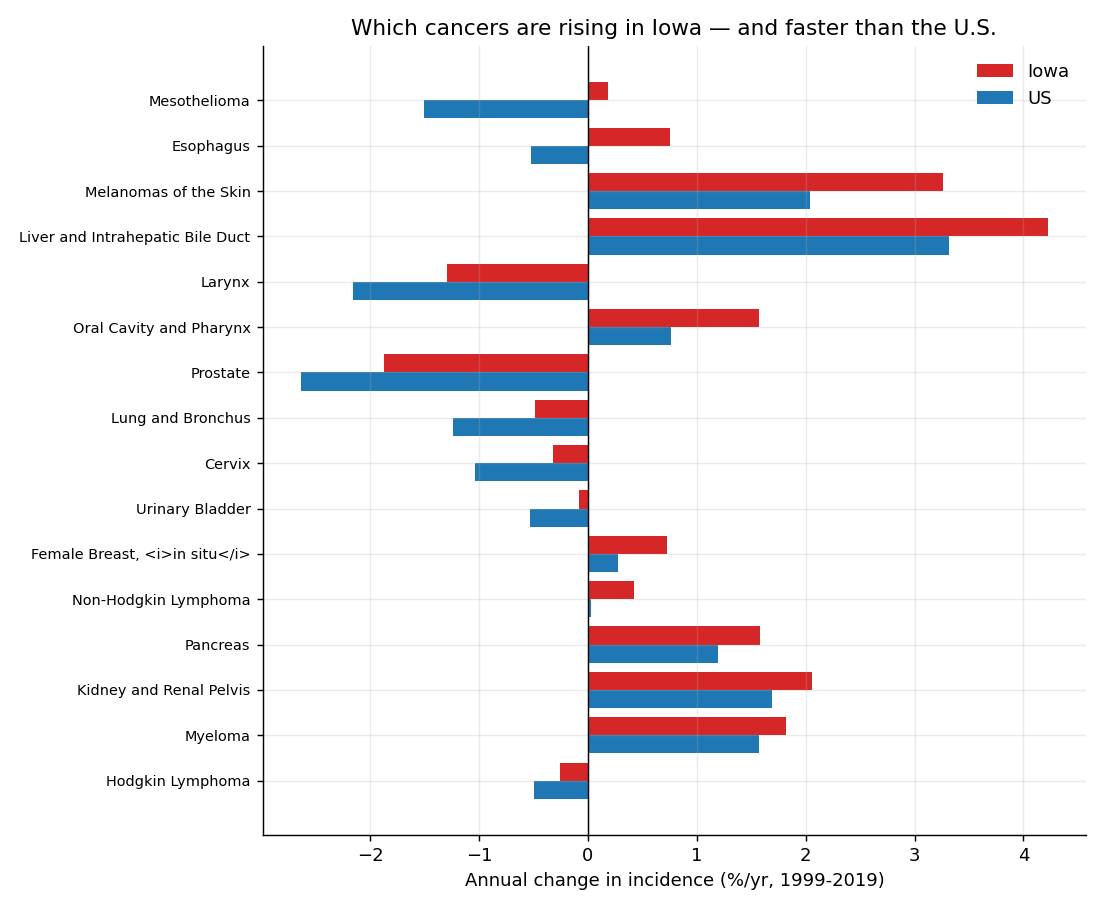
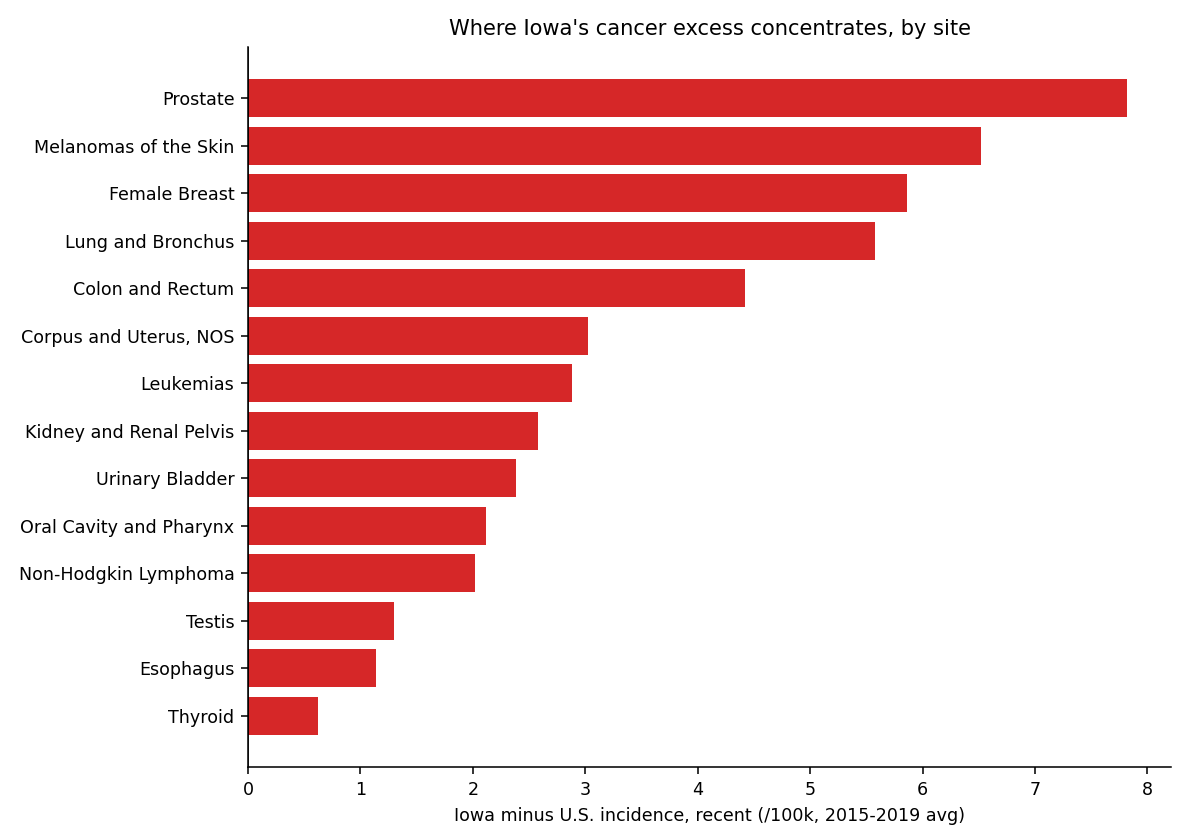
Which cancers drive Iowa's profile
The fastest-rising Iowa sites — melanoma, liver, oral cavity, esophagus — are UV- and alcohol-related, matching the Iowa Cancer Registry's emphasis on alcohol (the one modifiable factor where Iowa “stands out”) and sun exposure.
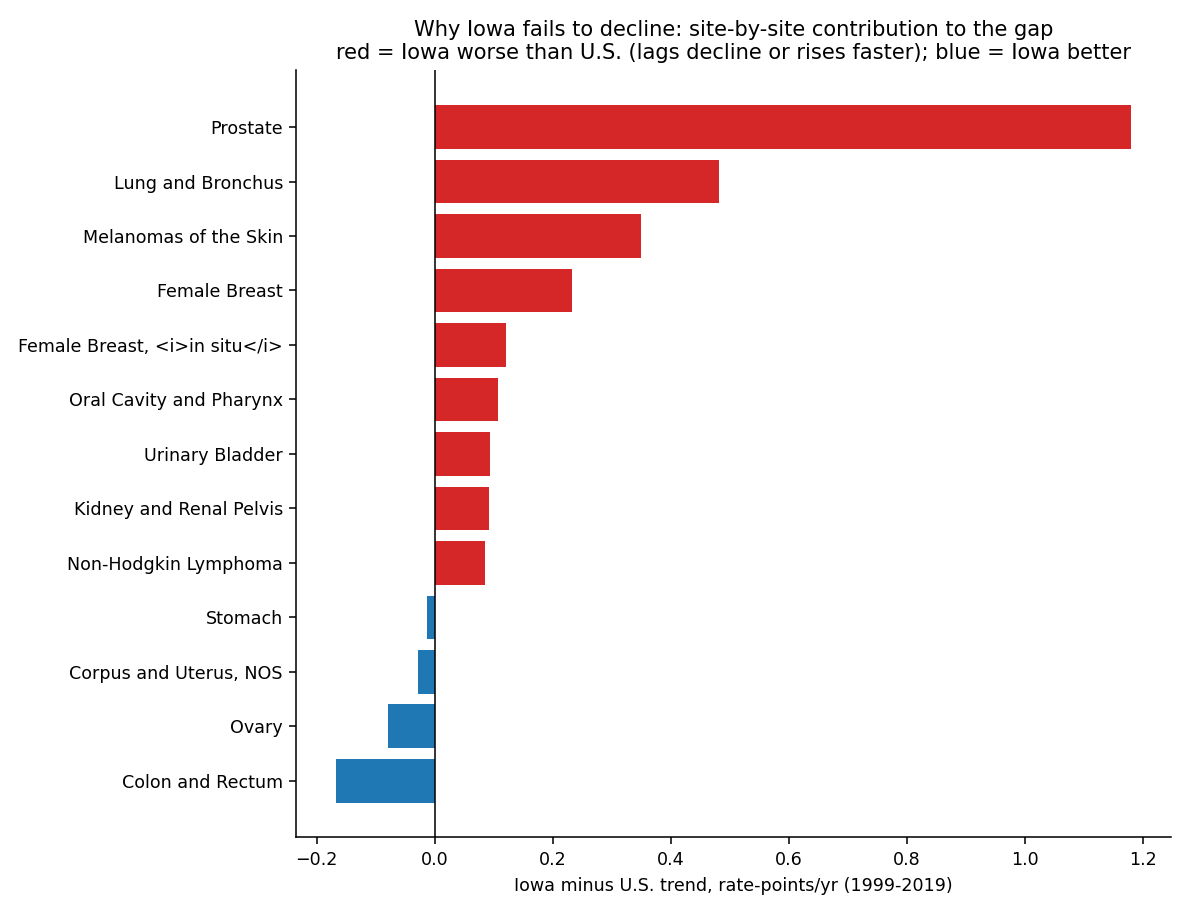
Why Iowa fails to decline at the national rate
The deepest version of the question: the U.S. all-cancer rate is falling (−1.6 rate-points/yr) while Iowa is flat-to-rising. We decomposed that Iowa-minus-U.S. trend gap (+2.7 rate-points/yr) site by site. Two cancers explain most of it — and the reasons are screening and smoking history, not a new toxin.
| Site | Iowa trend | U.S. trend | Contribution to gap | Why |
|---|---|---|---|---|
| Prostate | −2.5/yr | −3.7/yr | +1.18 | Iowa's prostate fell far less — PSA-screening dynamics |
| Lung | −0.3/yr | −0.8/yr | +0.48 | Smoking-legacy lag (Iowa lung mortality −1.6 vs U.S. −2.4%/yr) |
| Melanoma | +0.8/yr | +0.4/yr | +0.35 | Rises faster — UV/sun + outdoor work |
| Female breast | +0.3/yr | +0.1/yr | +0.23 | Rises while U.S. flat |
| Colon & rectum | −1.2/yr | −1.0/yr | −0.17 | Iowa declines faster — better screening (helps) |
Splitting the gap: ~62% comes from classic cancers (prostate, lung) declining too slowly, and ~38% from faster-rising cancers (melanoma, breast). The rest of the country drove its rate down mainly by quitting smoking (lung) and by the post-2012 pullback in PSA over-screening (prostate); Iowa lagged on both.
The counter-intuitive part: it is NOT a screening problem
The obvious guess — “rural Iowa under-screens” — is wrong. Iowa's colorectal screening (~74%) is above the U.S. (~61–67%); lung CT screening (18.4%) and early-stage diagnosis match the nation. Iowa's slower declines reflect higher risk-factor burden, not screening access:
- Smoking legacy (biggest, established): Iowa smoking is persistently above the U.S. (~12.9% vs 11.6%, 34th); lung incidence +14% above national and falling at only −0.49 vs −1.24%/yr. Lung is the single biggest engine of the national decline — and Iowa barely rides it.
- Weak tobacco policy (the cause behind it): Iowa's cigarette tax has been frozen at $1.36/pack since 2007, and dedicated tobacco-prevention funding was eliminated (ALA “F” grades).
- Alcohol: Iowa binge drinking ~22% vs ~17% U.S. props up breast, colorectal, liver, and oral cancers, offsetting the screening gains.
- Prostate is the largest single number in the decomposition, but it's a detection effect — Iowa kept more PSA testing, so it captured less of the national post-2012 prostate drop.
Sources: America's Health Rankings (BRFSS); ALA State of Lung Cancer & State of Tobacco Control 2025; Cancer in Iowa 2024; Annual Report to the Nation 2025.
A natural experiment rules pesticides out
Iowa's neighbors farm the same Corn Belt with the same herbicides. If pesticides drove Iowa's rise, they should rise too. They don't:
| State | All-cancer trend (1999–2019) | Direction |
|---|---|---|
| Iowa | +0.06%/yr | Not declining |
| Minnesota | +0.04%/yr | Not declining |
| Nebraska | −0.21%/yr | Declining |
| Illinois | −0.33%/yr | Declining |
| Wisconsin | −0.14%/yr | Declining |
| South Dakota | −0.22%/yr | Declining |
| United States | −0.34%/yr | Declining |
Individual state slopes are small and some are not statistically significant on their own; what is robust is the pattern — the four heavy-pesticide neighbors track the national decline while Iowa and Minnesota do not.
The registry agrees
The Iowa Cancer Registry's own Agricultural Health Study cohort found Iowa farmers had 13% fewer cancers overall than expected (a healthy-worker effect — less smoking and drinking). Pesticide excess appeared only in narrow, highly-exposed applicator subgroups. Pesticides are not supported as the population driver of Iowa's rise.
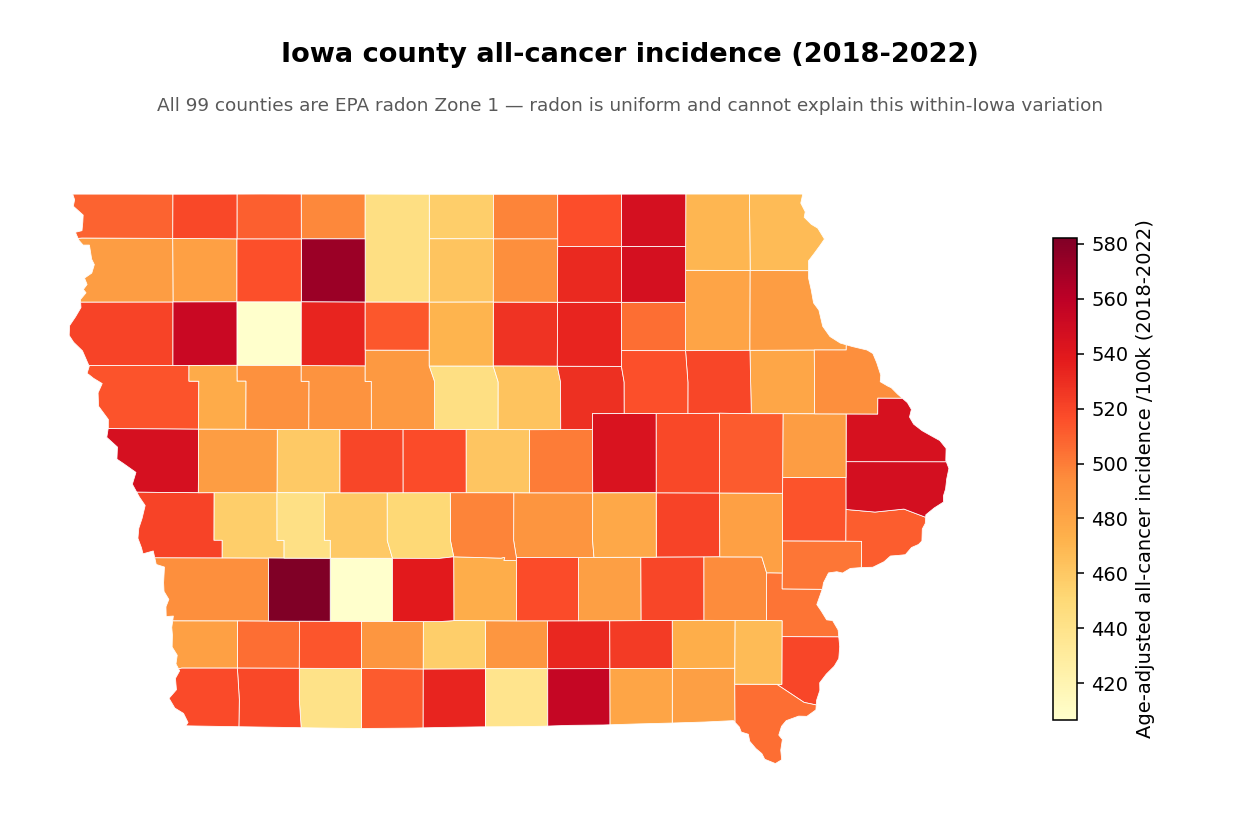
Within Iowa: no single local factor explains the map
All 99 Iowa counties are EPA radon Zone 1, so radon is uniform and cannot explain within-state variation. Across the 99 counties, no candidate factor (alcohol, smoking, obesity, age, nitrate, agriculture) reaches significance, and pesticides are if anything inversely related to county cancer rates. The geography is scattered, consistent with a multifactorial, detection-heavy story rather than one local exposure.
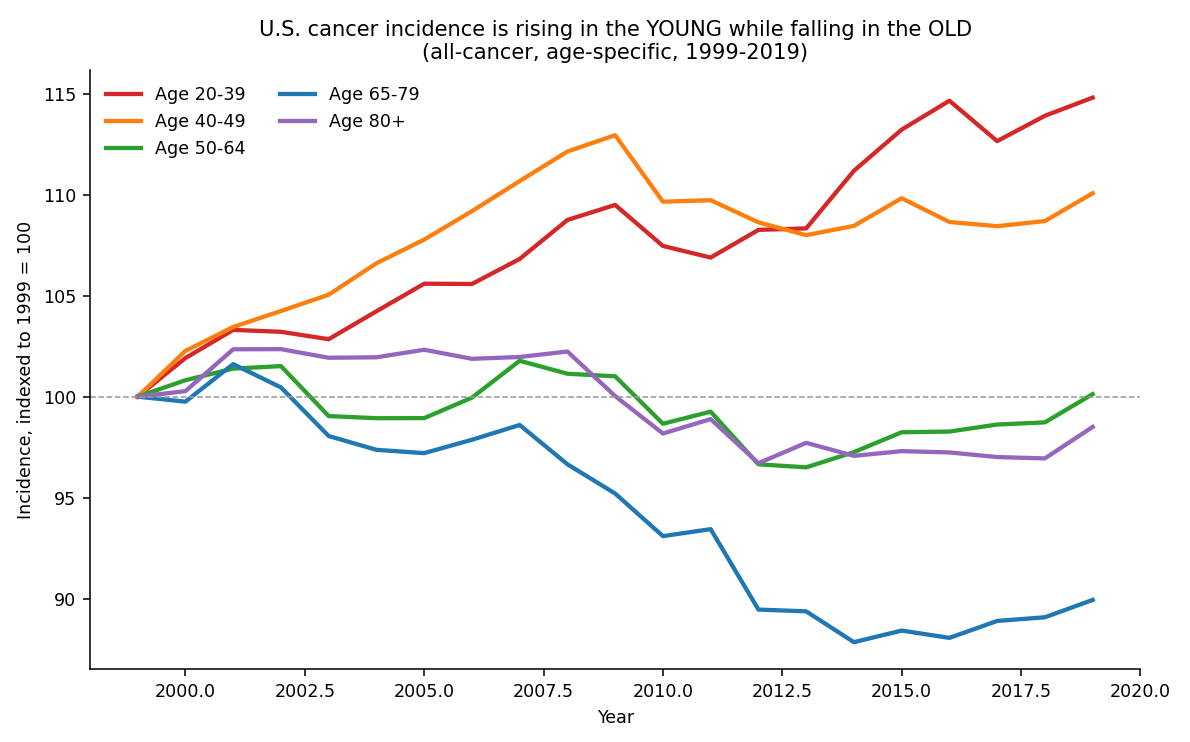
Why are early-onset cancers rising?
The most striking and genuinely unexplained signal. Nationally, cancer incidence is rising in young adults while falling in older ones: ages 20–39 up +0.63%/yr (1999–2019) and 40–49 up +0.32%/yr, even as ages 65–79 fell −0.77%/yr. Because age-adjustment up-weights these rising young strata, the early-onset surge is part of why the age-adjusted total keeps climbing. (Data limitation: the USCS age file is national-only, so Iowa-specific young-adult trends can't be isolated here — but the Iowa Cancer Registry reports Iowa ranks 2nd nationally for ages 20–39.)
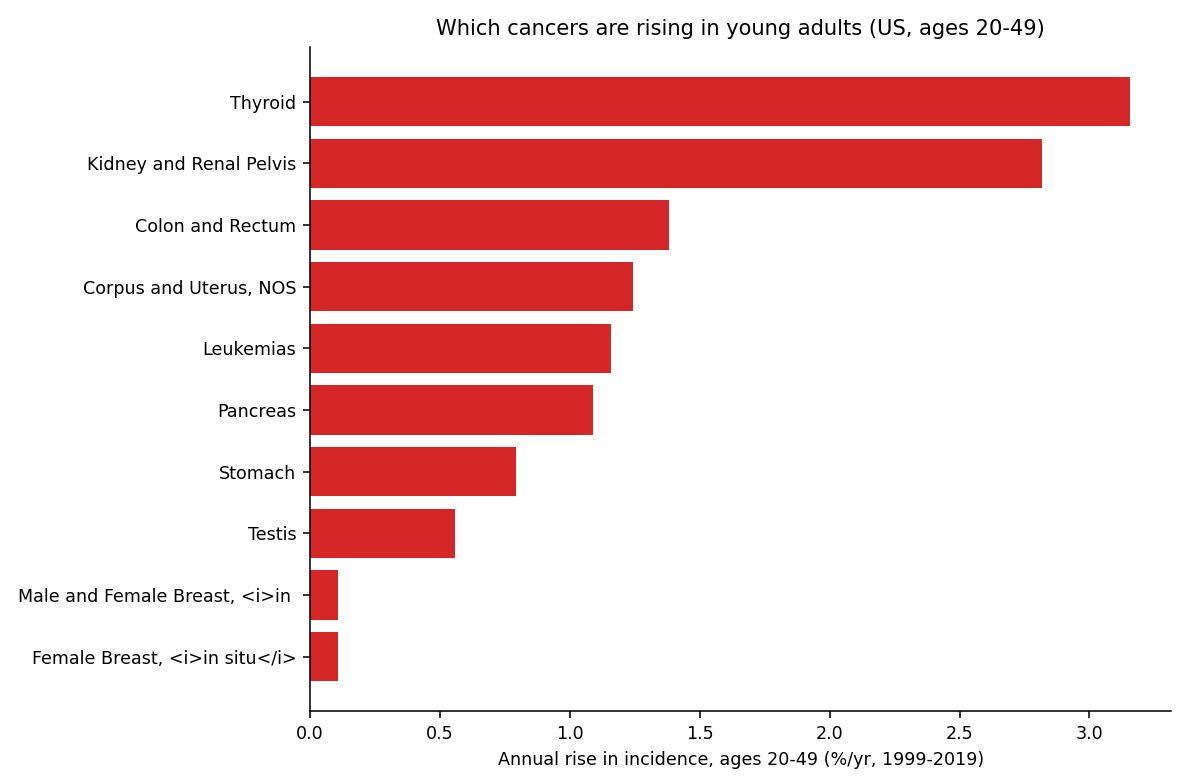
The cancers driving it — colorectal (+1.4%/yr), kidney, uterine, pancreas, plus the detection-sensitive thyroid — are mostly the obesity- and metabolic-linked cancers (8 of the 14 rising under-50 cancers worldwide are digestive). And it is real, not just detection: for several sites (pancreas, kidney, liver) mortality is rising too, and the 1990 birth cohort has ~2–3× the rate of the 1955 cohort [Sung et al., Lancet Public Health 2024].
The leading explanation: a birth-cohort effect from early-life exposures (unsolved)
Risk tracks the year you were born, not your age — so whatever changed must have changed in early life for generations born since the 1950s. After 15 years of study it remains multifactorial and unsolved. Ranked by strength of evidence:
- Tier 1 (strongest): obesity & metabolic dysfunction (but many patients are lean → necessary, not sufficient); the Western/ultra-processed diet; and the gut microbiome — a 2025 Nature study found a colibactin bacterial “fingerprint” ~3× enriched in early-onset colorectal cancer, implying exposure in the first ~10 years of life.
- Tier 2 (real but too weak alone): alcohol; sedentary behavior.
- Tier 3 (emerging): accelerated biological aging; circadian/sleep disruption.
- Tier 4 (speculative): microplastics, PFAS — named as hypotheses but “no strong epidemiological evidence” yet (NCI).
- Ruled out as the driver: inherited genetics — the genome cannot shift in 2–3 generations; it explains only ~10–20% even in the youngest.
Iowa angle: the registry reports Iowa's 20–39 incidence is above the U.S., rose significantly, and ranks 2nd nationally (top types: melanoma, breast, thyroid) — but young-adult mortality did not rise, so it's partly real and partly earlier detection. The registry has not decomposed it by cause, and our age data is national-only, so Iowa-specific drivers can't be isolated here. (Sources: Ugai 2022 Nat Rev Clin Oncol; Sung 2024 Lancet Public Health; Díaz-Gay/Alexandrov 2025 Nature; Cancer in Iowa 2026.)
What about radon, nitrate, and the early-onset surge?
Real, but lung-only
Iowa's indoor radon (~8.5 pCi/L, ~6× national) is genuinely extreme and raises lung-cancer baseline. But lung mortality is falling (less smoking), and radon doesn't touch rising breast/prostate/melanoma. It is not the multi-site driver.
Emerging, unproven
Drinking-water nitrate→prostate cancer is genuine new peer-reviewed evidence (Spaur 2026, HR≈1.16), but modest, single-cohort, and modeled-exposure. A lead worth investigating — not a conclusion.
The real puzzle
The registry's strongest unexplained signal: cancer in adults 20–39 is rising and Iowa ranks 2nd nationally. Our national-only age data can't localize it — a genuine open question and a stated limitation.
Sources: USCS 1999–2023; Iowa Cancer Registry “Cancer in Iowa” 2023–2026; EPA radon zones. Reproduced by
analysis/p3_iowa_trends.py and p3b_iowa_counties.py.